- The historical correlation between Bitcoin and the U.S. dollar is set for another cameo this bull run.
- Bitcoin is nearing fair value price as long-term holders accumulated more BTC.
Price movement patterns often repeat themselves, which aids in predicting future prices of assets like Bitcoin [BTC] and other cryptocurrencies.
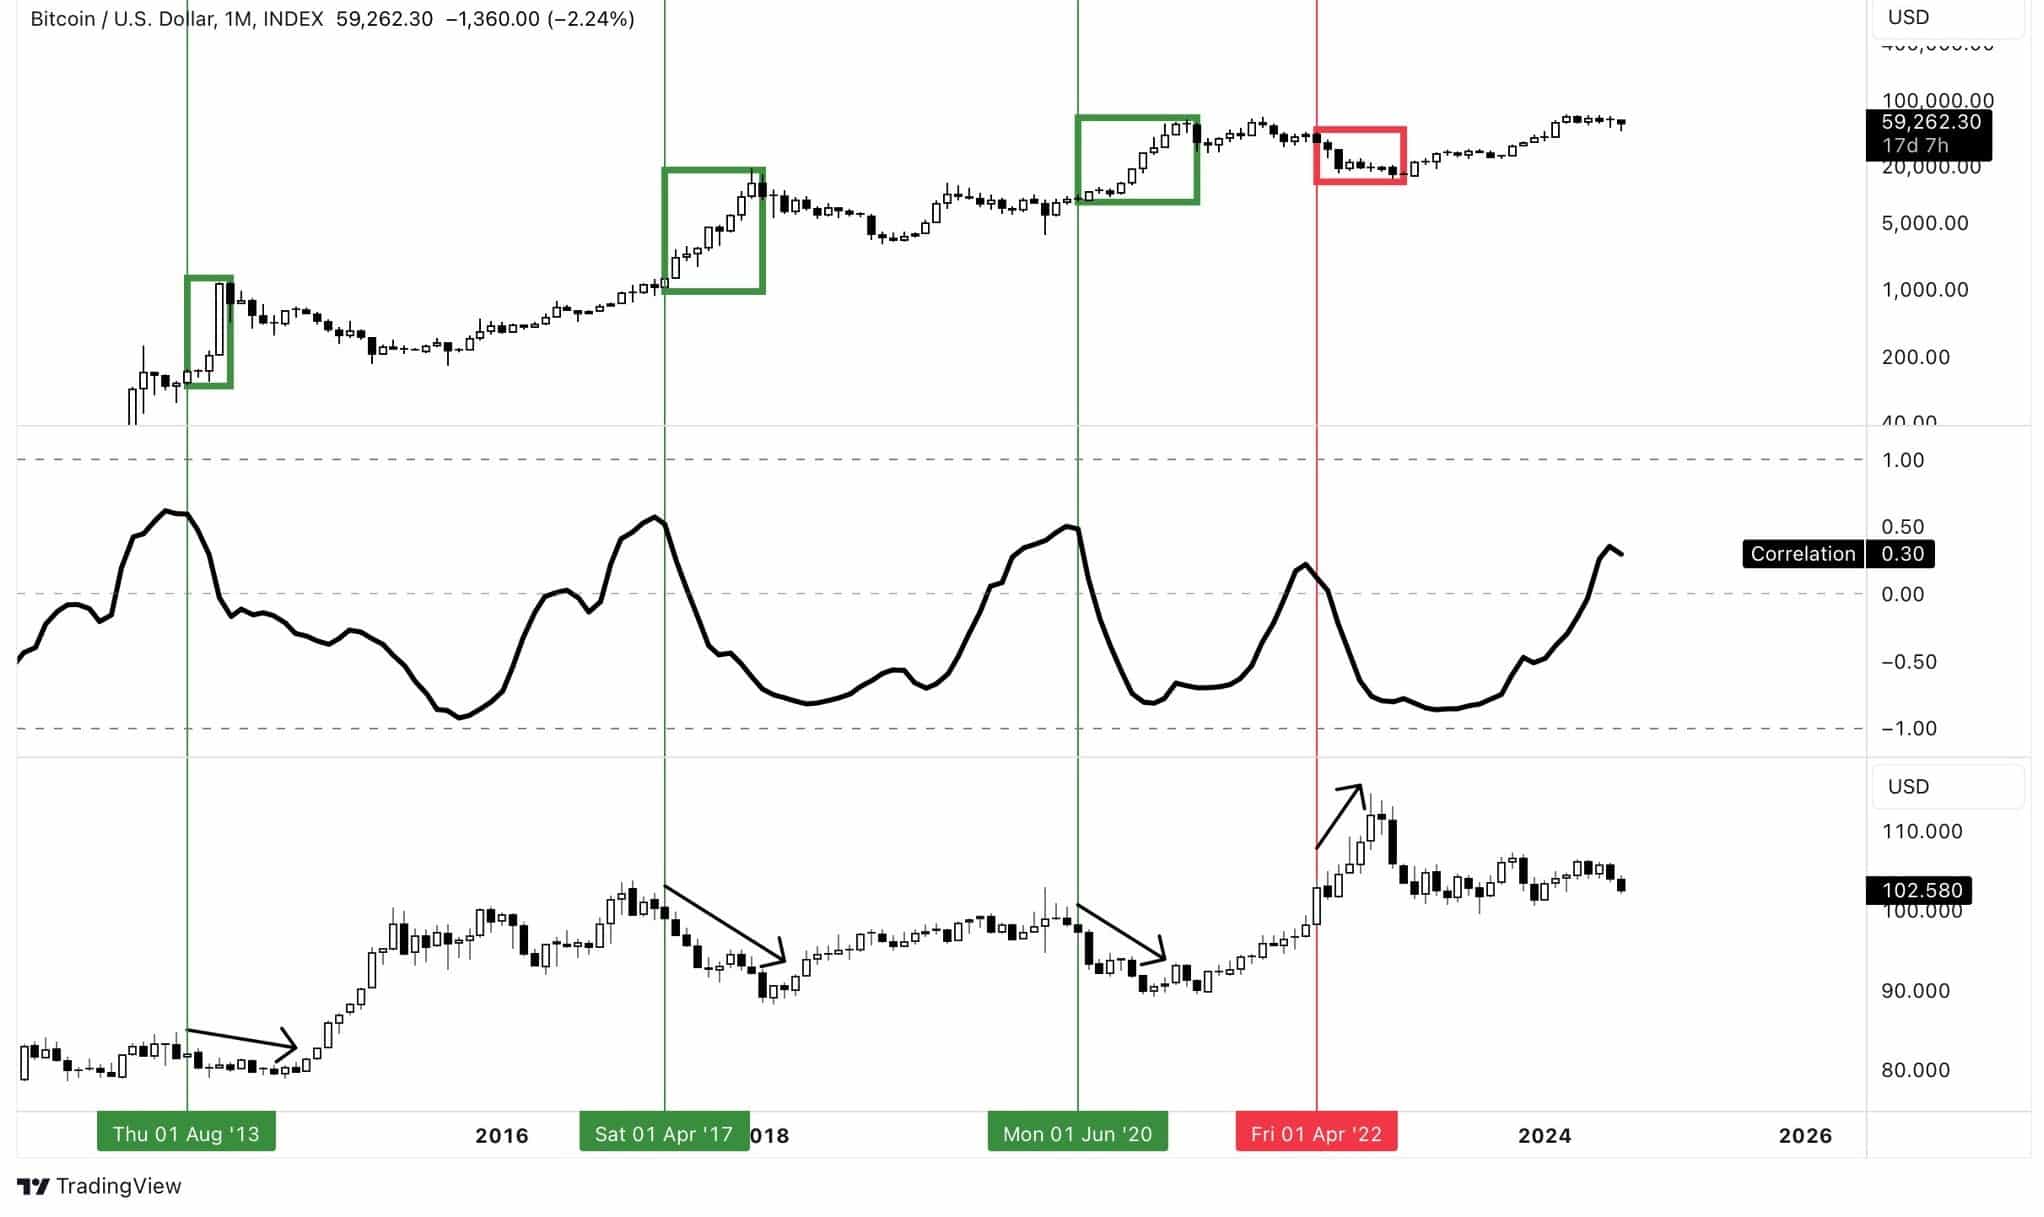
Analyzing the BTC/USD and DXY charts alongside their correlation coefficient revealed a key pattern — when BTC’s monthly correlation with DXY shifts from positive, it signals a major move, but the direction is not certain.
Historically, this has led Bitcoin to the final leg of a bull run 75% of the time or a drop during a bear market 25% of the time.
Source: TradingView
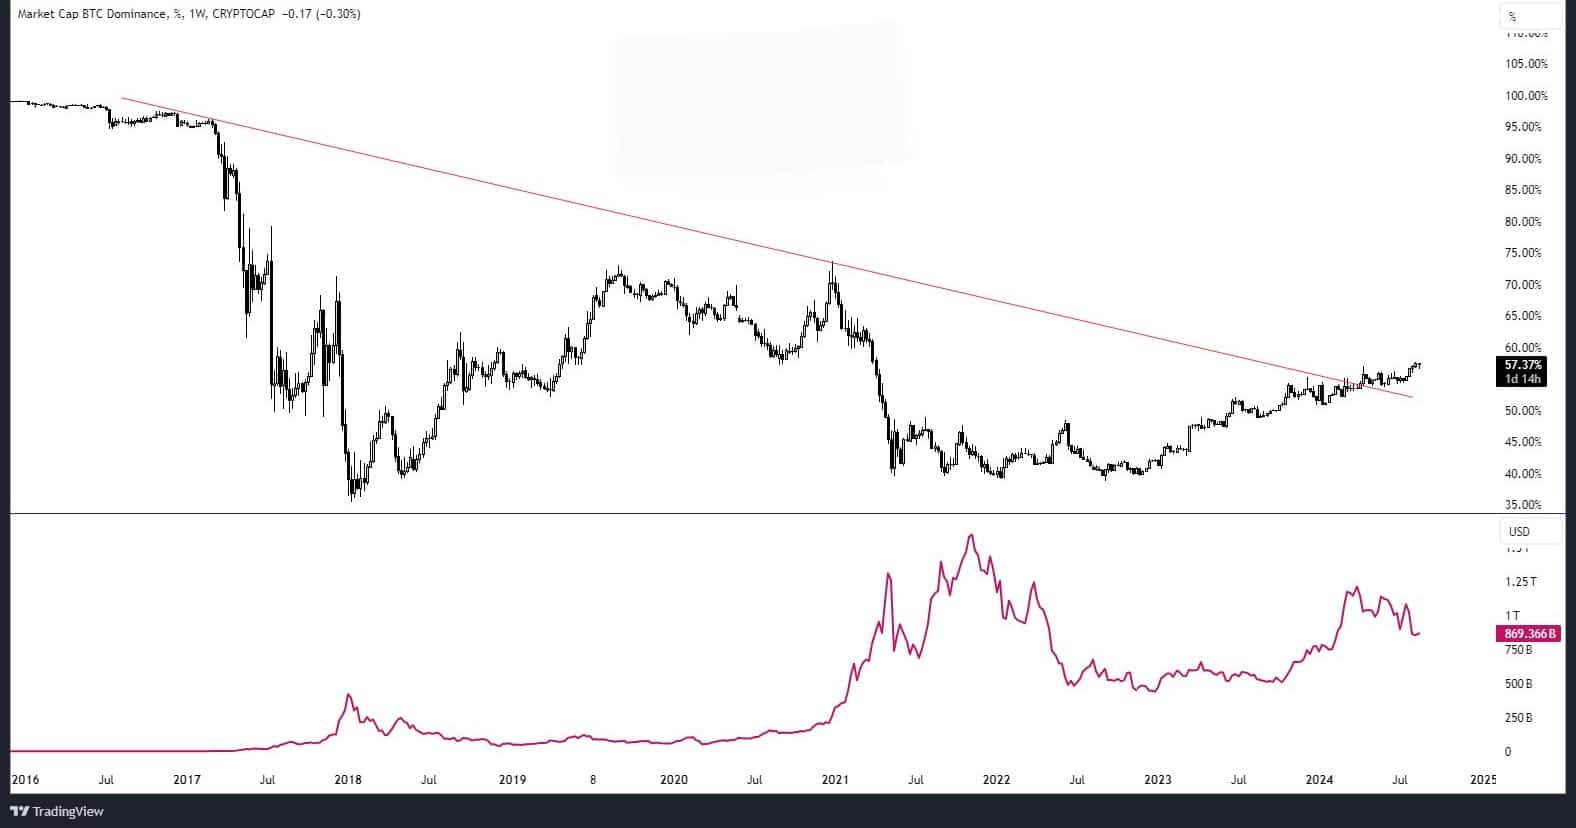
Many analysts are uncertain about Bitcoin’s next direction, but AMBCrypto has the answer. First, Bitcoin’s weekly dominance chart has broken out of a descending trendline, signaling potential strength.
Despite recent price declines, Bitcoin has reclaimed the $60K level. Meanwhile, altcoin market caps appear to have bottomed out and are now starting to trend upward.
This indicated that Bitcoin and other cryptocurrencies may be preparing for a significant upward movement.
Source: TradingView
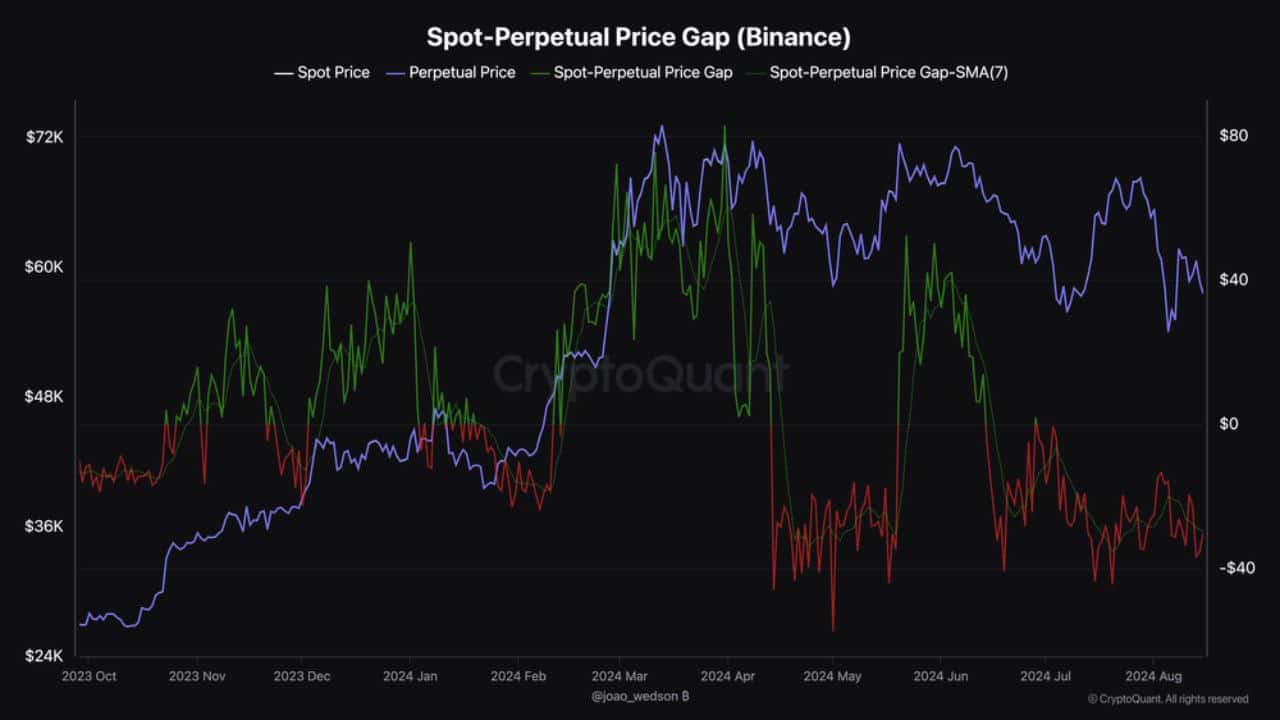
However, the Spot-Perpetual Price Gap on Binance from CryptoQuant remained negative, showing ongoing selling pressure on Bitcoin.
This gap, driven by aggressive liquidations and short positions, suggested that BTC price was nearing its fair value. This signaled a potential opportunity for investors to buy, indicating Bitcoin was likely heading upward.
Source: CryptoQuant
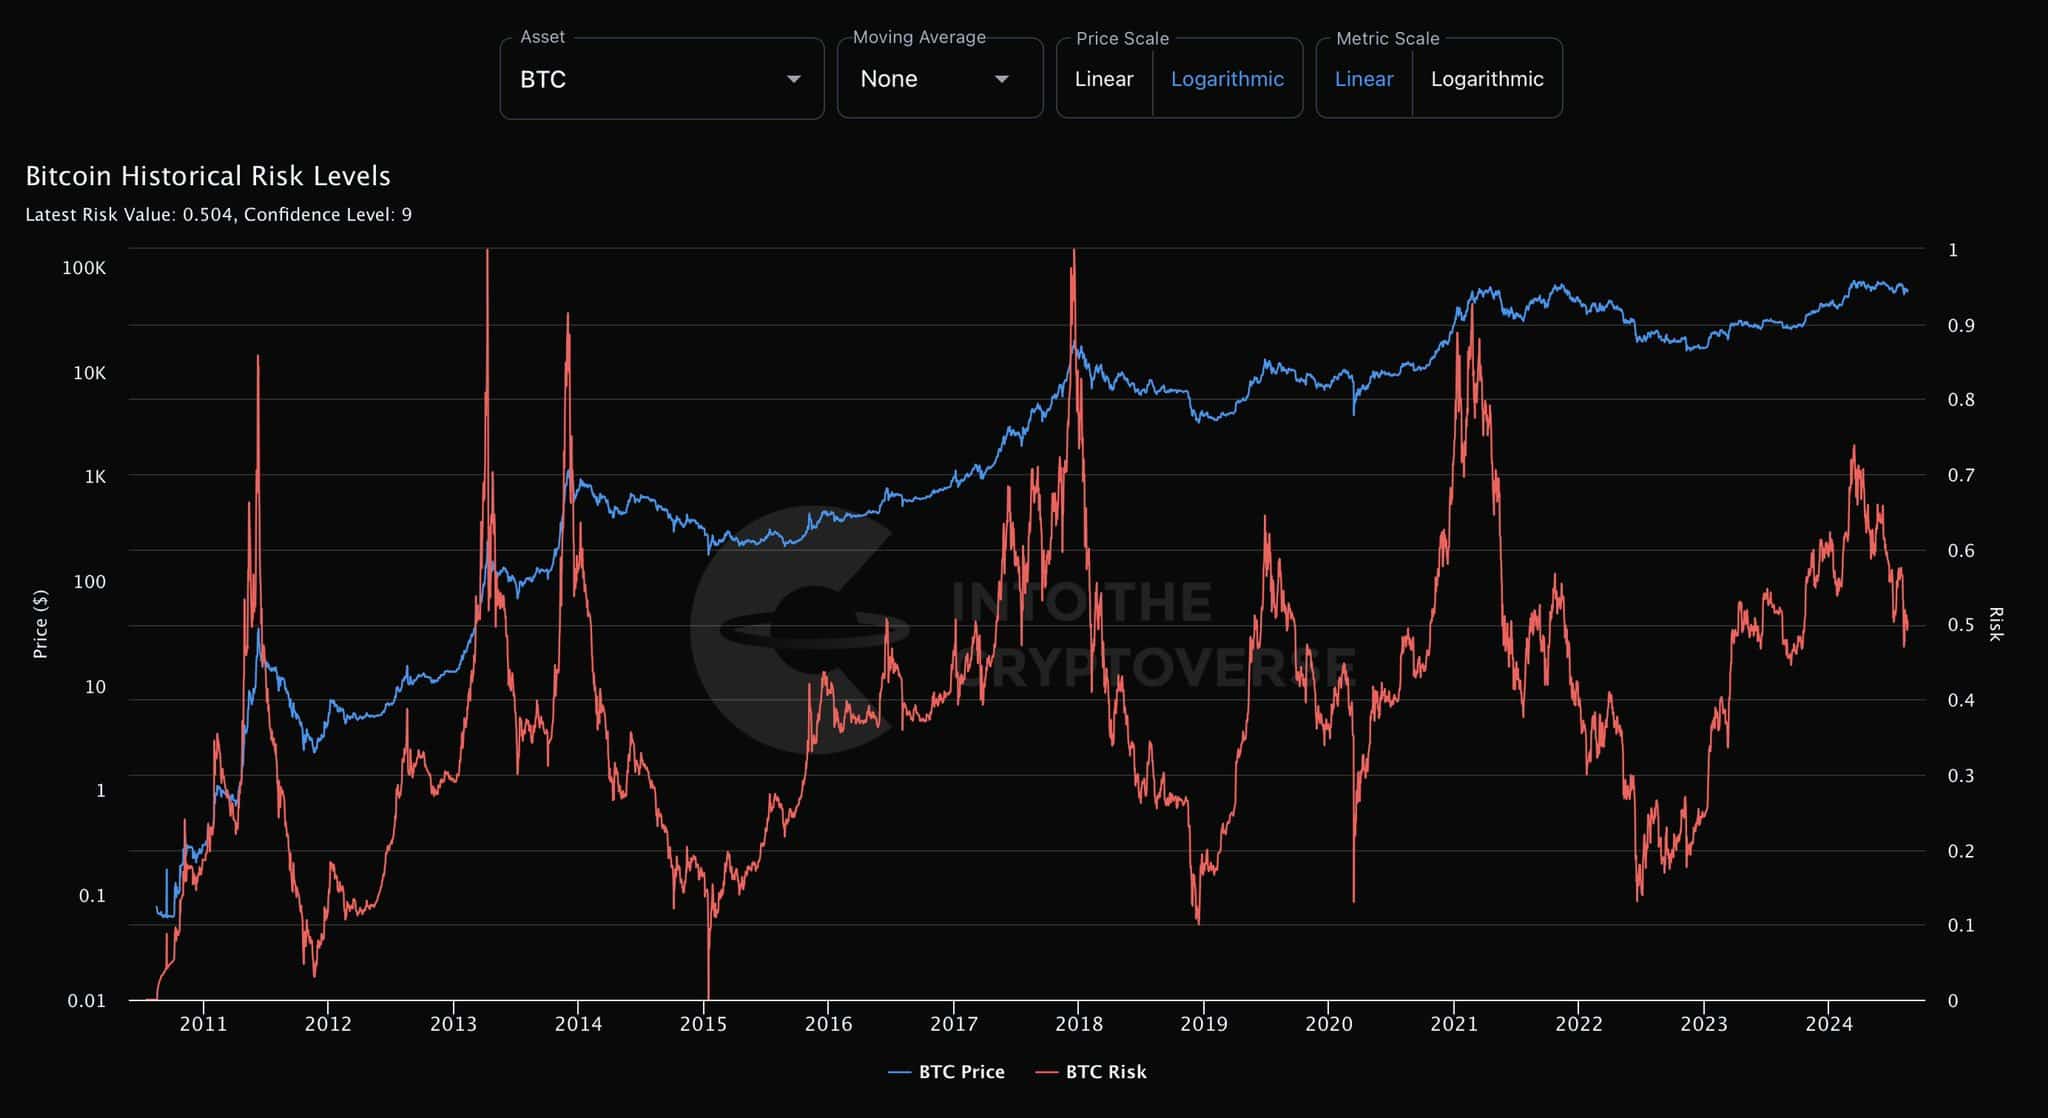
Bitcoin’s historical risk levels
The chart below highlights a risk level for Bitcoin, helping with long-term buying and selling points in the market. AT press time, the risk level was around 0.5, indicating low risk and a favorable buying opportunity.
Traders and investors can consider dynamic dollar-cost averaging in this region before risk levels rise, signaling the need to sell larger portions.
Source: Into The Cryptoverse
Also, since the 30th of July, over 500,000 BTC have been added to long-term holder wallets, signaling a bullish trend for Bitcoin.
This surge indicated that whales and institutions were actively accumulating Bitcoin, reflecting growing confidence in its future value.
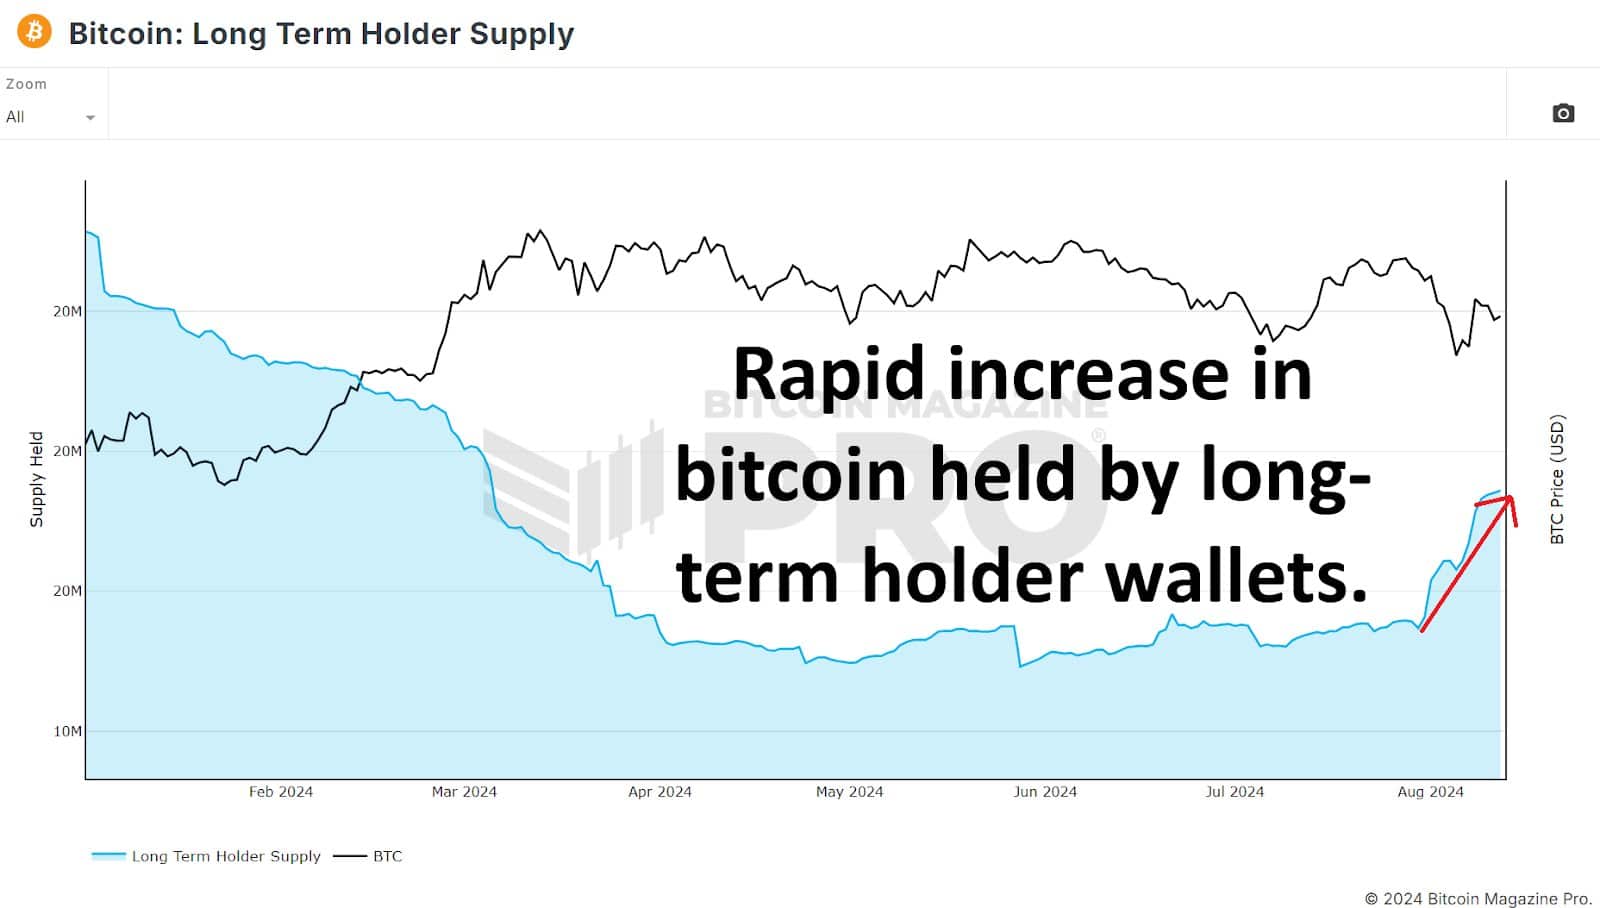
Source: Bitcoin Magazine PRO
Is your portfolio green? Check out the BTC Profit Calculator
Finally, Bitcoin gained momentum over Ethereum at press time. The BTC/ETH market cap ratio has steadily increased in August, indicating stronger accumulation of the king coin.
This trend suggested that Bitcoin was poised for further upward movement.
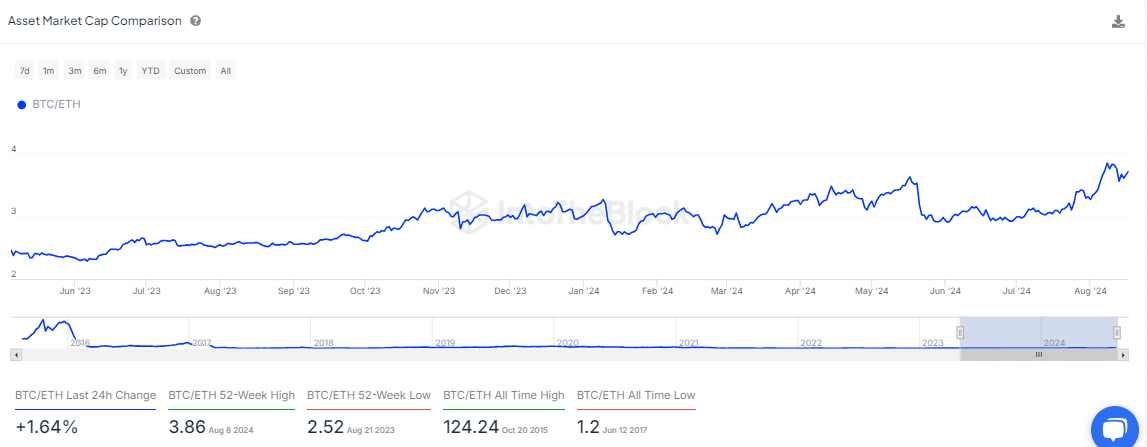
Source: IntoTheBlock
- The historical correlation between Bitcoin and the U.S. dollar is set for another cameo this bull run.
- Bitcoin is nearing fair value price as long-term holders accumulated more BTC.
Price movement patterns often repeat themselves, which aids in predicting future prices of assets like Bitcoin [BTC] and other cryptocurrencies.
Analyzing the BTC/USD and DXY charts alongside their correlation coefficient revealed a key pattern — when BTC’s monthly correlation with DXY shifts from positive, it signals a major move, but the direction is not certain.
Historically, this has led Bitcoin to the final leg of a bull run 75% of the time or a drop during a bear market 25% of the time.

Source: TradingView
Many analysts are uncertain about Bitcoin’s next direction, but AMBCrypto has the answer. First, Bitcoin’s weekly dominance chart has broken out of a descending trendline, signaling potential strength.
Despite recent price declines, Bitcoin has reclaimed the $60K level. Meanwhile, altcoin market caps appear to have bottomed out and are now starting to trend upward.
This indicated that Bitcoin and other cryptocurrencies may be preparing for a significant upward movement.

Source: TradingView
However, the Spot-Perpetual Price Gap on Binance from CryptoQuant remained negative, showing ongoing selling pressure on Bitcoin.
This gap, driven by aggressive liquidations and short positions, suggested that BTC price was nearing its fair value. This signaled a potential opportunity for investors to buy, indicating Bitcoin was likely heading upward.

Source: CryptoQuant
Bitcoin’s historical risk levels
The chart below highlights a risk level for Bitcoin, helping with long-term buying and selling points in the market. AT press time, the risk level was around 0.5, indicating low risk and a favorable buying opportunity.
Traders and investors can consider dynamic dollar-cost averaging in this region before risk levels rise, signaling the need to sell larger portions.

Source: Into The Cryptoverse
Also, since the 30th of July, over 500,000 BTC have been added to long-term holder wallets, signaling a bullish trend for Bitcoin.
This surge indicated that whales and institutions were actively accumulating Bitcoin, reflecting growing confidence in its future value.

Source: Bitcoin Magazine PRO
Is your portfolio green? Check out the BTC Profit Calculator
Finally, Bitcoin gained momentum over Ethereum at press time. The BTC/ETH market cap ratio has steadily increased in August, indicating stronger accumulation of the king coin.
This trend suggested that Bitcoin was poised for further upward movement.

Source: IntoTheBlock


You are my inspiration , I possess few blogs and often run out from to brand.
Definitely, what a splendid blog and enlightening posts, I will bookmark your website.Best Regards!
It’s in point of fact a great and useful piece of information. I am glad that you just shared this helpful info with us. Please keep us up to date like this. Thanks for sharing.
An interesting discussion is worth comment. I think that you should write more on this topic, it might not be a taboo subject but generally people are not enough to speak on such topics. To the next. Cheers
Purdentix
Purdentix
Purdentix reviews
This site truly stands out as a great example of quality web design and performance.
It provides an excellent user experience from start to finish.
I love how user-friendly and intuitive everything feels.
The design and usability are top-notch, making everything flow smoothly.
I’m really impressed by the speed and responsiveness.
A perfect blend of aesthetics and functionality makes browsing a pleasure.
The content is engaging and well-structured, keeping visitors interested.
A perfect blend of aesthetics and functionality makes browsing a pleasure.
The content is well-organized and highly informative.
The content is engaging and well-structured, keeping visitors interested.
This website is amazing, with a clean design and easy navigation.
The content is well-organized and highly informative.
This website is amazing, with a clean design and easy navigation.
The content is engaging and well-structured, keeping visitors interested.
The layout is visually appealing and very functional.
The content is well-organized and highly informative.
It provides an excellent user experience from start to finish.
I’m really impressed by the speed and responsiveness.
I love how user-friendly and intuitive everything feels.
This site truly stands out as a great example of quality web design and performance.
This site truly stands out as a great example of quality web design and performance.
The layout is visually appealing and very functional.
This site truly stands out as a great example of quality web design and performance.
The content is engaging and well-structured, keeping visitors interested.
The layout is visually appealing and very functional.
The content is well-organized and highly informative.
A perfect blend of aesthetics and functionality makes browsing a pleasure.
This site truly stands out as a great example of quality web design and performance.
The content is well-organized and highly informative.
Every expert was once a beginner. Keep pushing forward, and one day, you’ll look back and see how far you’ve come. Progress is always happening, even when it doesn’t feel like it.
All knowledge, it is said, comes from experience, but does that not mean that the more we experience, the wiser we become? If wisdom is the understanding of life, then should we not chase every experience we can, taste every flavor, walk every path, and embrace every feeling? Perhaps the greatest tragedy is to live cautiously, never fully opening oneself to the richness of being.
Virtue, they say, lies in the middle, but who among us can truly say where the middle is? Is it a fixed point, or does it shift with time, perception, and context? Perhaps the middle is not a place but a way of moving, a constant balancing act between excess and deficiency. Maybe to be virtuous is not to reach the middle but to dance around it with grace.
Man is said to seek happiness above all else, but what if true happiness comes only when we stop searching for it? It is like trying to catch the wind with our hands—the harder we try, the more it slips through our fingers. Perhaps happiness is not a destination but a state of allowing, of surrendering to the present and realizing that we already have everything we need.
Even the gods, if they exist, must laugh from time to time. Perhaps what we call tragedy is merely comedy from a higher perspective, a joke we are too caught up in to understand. Maybe the wisest among us are not the ones who take life the most seriously, but those who can laugh at its absurdity and find joy even in the darkest moments.
Saya sangat mengapresiasi cara penulis mengupas informasi dalam artikel ini.
slot deposit pulsa tanpa potongan – Buat kalian yang masih ragu atau bingung mulai dari mana, artikel ini sangat layak dibaca. Jangan sampai ketinggalan info penting kayak gini, apalagi kalau kalian lagi cari peluang menang terbesar. Ingat, referensi yang akurat bisa jadi kunci sukses kalian di dunia judi game.
slot gacor hari ini – Saya pribadi sangat mengapresiasi gaya penyampaian artikel ini. Penjelasannya mudah dimengerti dan langsung menyasar ke inti pembahasan, bikin makin percaya buat daftar di situs slot gacor yang dibahas.
Virtue, they say, lies in the middle, but who among us can truly say where the middle is? Is it a fixed point, or does it shift with time, perception, and context? Perhaps the middle is not a place but a way of moving, a constant balancing act between excess and deficiency. Maybe to be virtuous is not to reach the middle but to dance around it with grace.
The potential within all things is a mystery that fascinates me endlessly. A tiny seed already contains within it the entire blueprint of a towering tree, waiting for the right moment to emerge. Does the seed know what it will become? Do we? Or are we all simply waiting for the right conditions to awaken into what we have always been destined to be?
Keep functioning ,splendid job!
Keep up the wonderful piece of work, I read few articles on this site and I conceive that your weblog is really interesting and has got sets of excellent info .
Attractive part of content. I simply stumbled upon your blog and in accession capital to claim that I acquire actually enjoyed account your weblog posts. Any way I’ll be subscribing for your augment or even I achievement you get entry to persistently fast.
where can i buy generic clomid tablets buy cheap clomid without prescription can i get cheap clomid how can i get cheap clomiphene tablets cost of cheap clomid without rx clomid tablet price how to buy generic clomid price
More content pieces like this would insinuate the web better.
This is the amicable of serenity I get high on reading.
buy semaglutide for sale – buy semaglutide 14mg online cheap cyproheptadine 4 mg uk
buy generic domperidone online – buy cyclobenzaprine tablets flexeril for sale online
buy inderal 20mg generic – order generic inderal 20mg methotrexate 2.5mg pills
amoxicillin medication – amoxil cheap ipratropium sale
order zithromax 250mg sale – buy azithromycin generic bystolic us
buy augmentin without prescription – atbioinfo.com ampicillin medication
brand nexium – https://anexamate.com/ cheap esomeprazole
order warfarin 2mg pills – anticoagulant buy losartan 50mg generic
meloxicam 15mg pill – tenderness order meloxicam 15mg pills
Great weblog right here! Also your web site quite a bit up fast! What web host are you the usage of? Can I get your associate link to your host? I desire my website loaded up as quickly as yours lol
order prednisone 5mg online cheap – aprep lson oral deltasone 40mg
top erection pills – fastedtotake buy ed medication online
amoxicillin oral – buy amoxicillin cheap buy amoxicillin sale
lexapro 10mg over the counter – https://escitapro.com/# buy lexapro pills for sale
oral cenforce – site buy cenforce 50mg pill
cialis com coupons – https://ciltadgn.com/# is there a generic equivalent for cialis
cialis as generic – site is tadalafil peptide safe to take
ranitidine 300mg cost – https://aranitidine.com/# ranitidine 300mg sale
viagra sale sa – https://strongvpls.com/ viagra professional 100 mg
This website exceedingly has all of the low-down and facts I needed about this subject and didn’t positive who to ask. this
Thanks on sharing. It’s top quality. order prednisone for sale
More articles like this would make the blogosphere richer. https://ursxdol.com/furosemide-diuretic/
The thoroughness in this section is noteworthy. https://prohnrg.com/product/omeprazole-20-mg/
Hi, Neat post. There is a problem with your site in internet explorer, might test this?K IE nonetheless is the marketplace chief and a huge part of folks will pass over your magnificent writing because of this problem.
Proof blog you have here.. It’s hard to on elevated calibre writing like yours these days. I honestly appreciate individuals like you! Withstand mindfulness!! https://aranitidine.com/fr/en_ligne_kamagra/
This is the compassionate of criticism I truly appreciate. https://ondactone.com/simvastatin/
Greetings! Jolly gainful advice within this article! It’s the scarcely changes which will obtain the largest changes. Thanks a a quantity for sharing!
imitrex pill
This website absolutely has all of the low-down and facts I needed there this participant and didn’t identify who to ask. http://www.orlandogamers.org/forum/member.php?action=profile&uid=28885
Can I simply say what a reduction to seek out someone who really knows what theyre speaking about on the internet. You positively know easy methods to carry a difficulty to light and make it important. More people need to learn this and perceive this side of the story. I cant imagine youre not more standard because you positively have the gift.
I would like to thnkx for the efforts you have put in writing this blog. I am hoping the same high-grade blog post from you in the upcoming as well. In fact your creative writing abilities has inspired me to get my own blog now. Really the blogging is spreading its wings quickly. Your write up is a good example of it.
I simply could not depart your site before suggesting that I extremely enjoyed the usual info an individual supply for your visitors? Is gonna be back steadily to check up on new posts
dapagliflozin 10mg drug – forxiga 10 mg uk forxiga for sale
xenical usa – https://asacostat.com/# orlistat 120mg pills
Lovely site! I am loving it!! Will come back again. I am bookmarking your feeds also
This website exceedingly has all of the bumf and facts I needed there this thesis and didn’t identify who to ask. https://experthax.com/forum/member.php?action=profile&uid=124797