


![What Is Asset Tokenization? Types, Why It Matters Now [2025]](https://coininsights.com/wp-content/uploads/2025/05/asset_tokenization-360x180.png)


- Bitcoin was down by more than 5% in the last 24 hours.
- Market indicators hinted at a continued price decline.
Bitcoin [BTC] continued to witness price corrections, as its value had dropped below the $66K mark at press time.
Though there were several factors at play, miners’ behavior might have impacted the king of cryptos’ price more negatively than investors realized.
Bitcoin miners are selling
BTC turned bearish in the recent past as its value dropped by over 5% in the last seven days. In the last 24 hours alone, BTC’s price witnessed yet another 5% correction.
According to CoinMarketCap, at the time of writing, BTC was trading at $64,953.22, with a market capitalization of over $1.2 trillion.
In the meantime, CryptoOnchain, an author and analyst at CryptoQuant, posted an analysis pointing out that BTC’s miners’ reserves were dropping.
To be precise, miners’ reserves have reached their lowest level since April 2021, meaning that miners were selling their holdings.
The analysis mentioned that this decline has been followed by a much steeper slope since the beginning of November, which might have been one of the reasons for increasing sales pressure in the market.
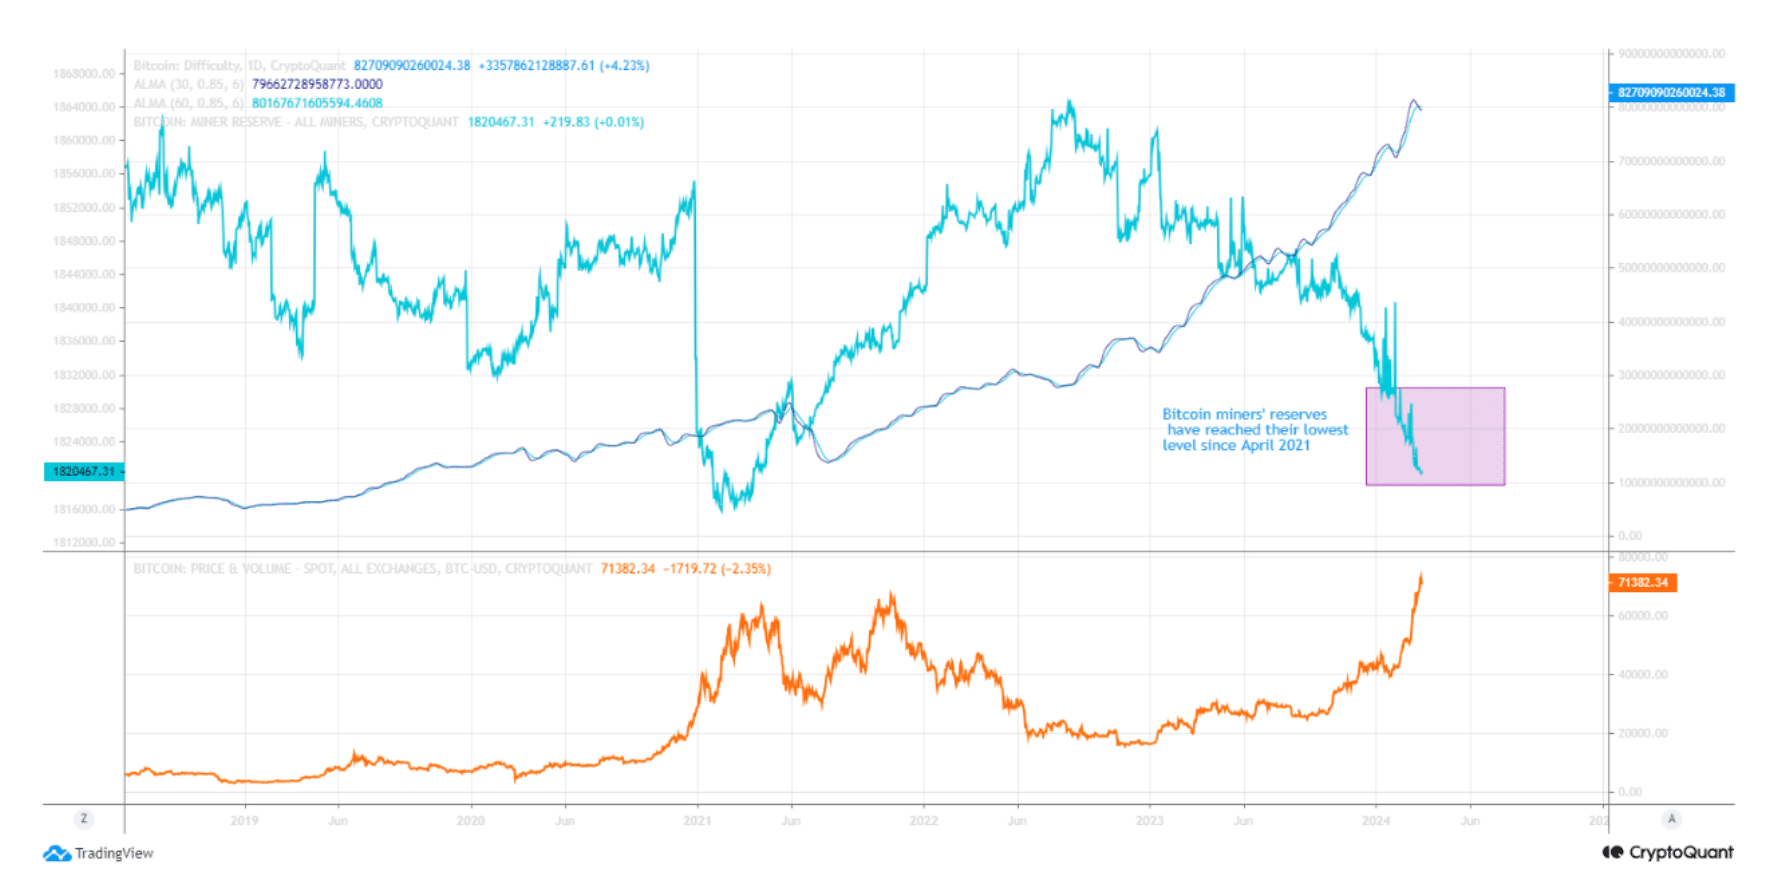
Source: CryptoQuant
To check whether selling pressure was high overall, AMBCrypto took a look at CryptoQuant’s data.
Our analysis revealed that BTC’s net deposit on exchanges was high compared to the last seven-day average, suggesting high selling pressure.
BTC’s aSOPR was in the red, meaning that more investors were selling at a profit at press time.
The king coin’s Binary CDD was also in the red, hinting that long-term holders’ movements in the last seven days were higher than average.
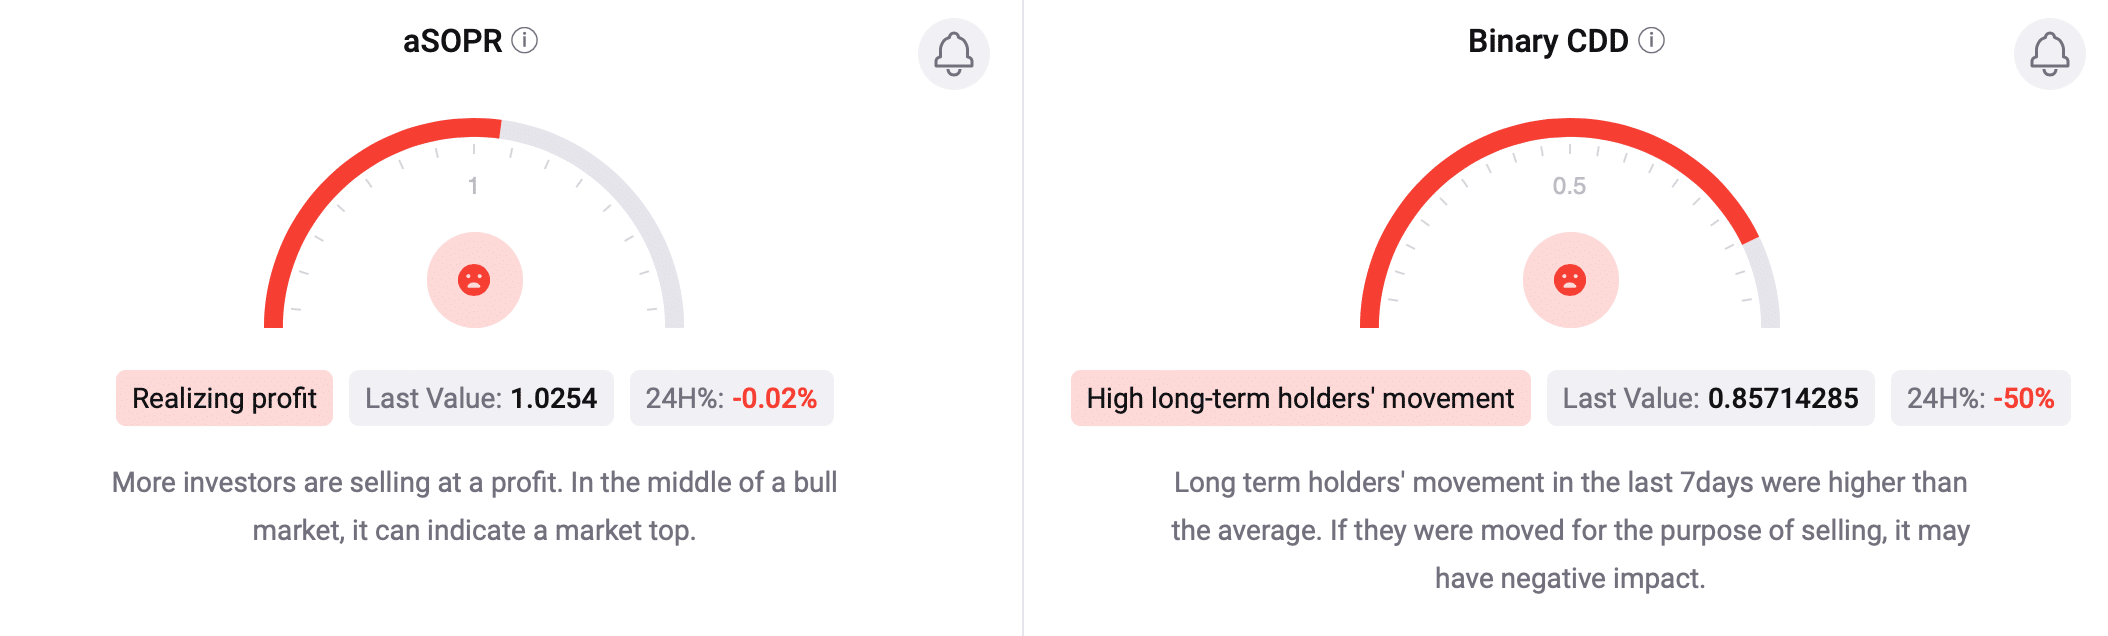
Source: CryptoQuant
Market sentiment looked bearish, as evident by Bitcoin’s Coinbase Premium. Notably, the metric revealed that selling sentiment was dominant among U.S. investors.
Its Korea Premium was also in the red, indicating that Korean investors were selling BTC, adding to the overall selling pressure.
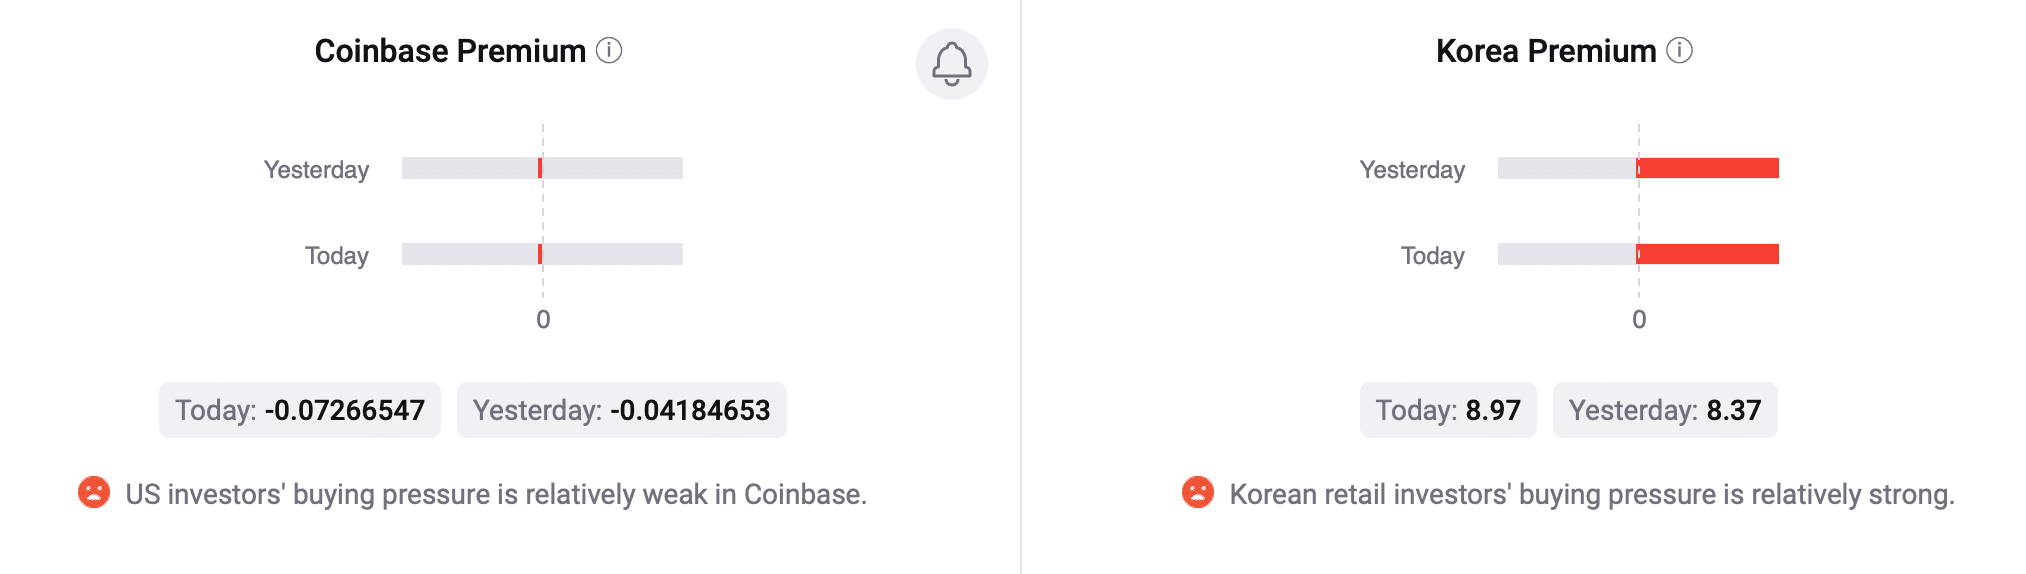
Source: CryptoQuant
Is a further downtrend on its way?
AMBCrypto’s analysis of Bitcoin’s daily chart suggested that the possibility of a further price decline was high. As per the Bollinger Bands, BTC’s rice went under its 20-day simple moving average (SMA).
Read Bitcoin’s [BTC] Price Prediction 2024-25
Its MACD displayed a bearish crossover as well.
Further, Bitcoin’s Relative Strength Index (RSI) registered a sharp downtick at press time, hinting at a continued southward price movement.
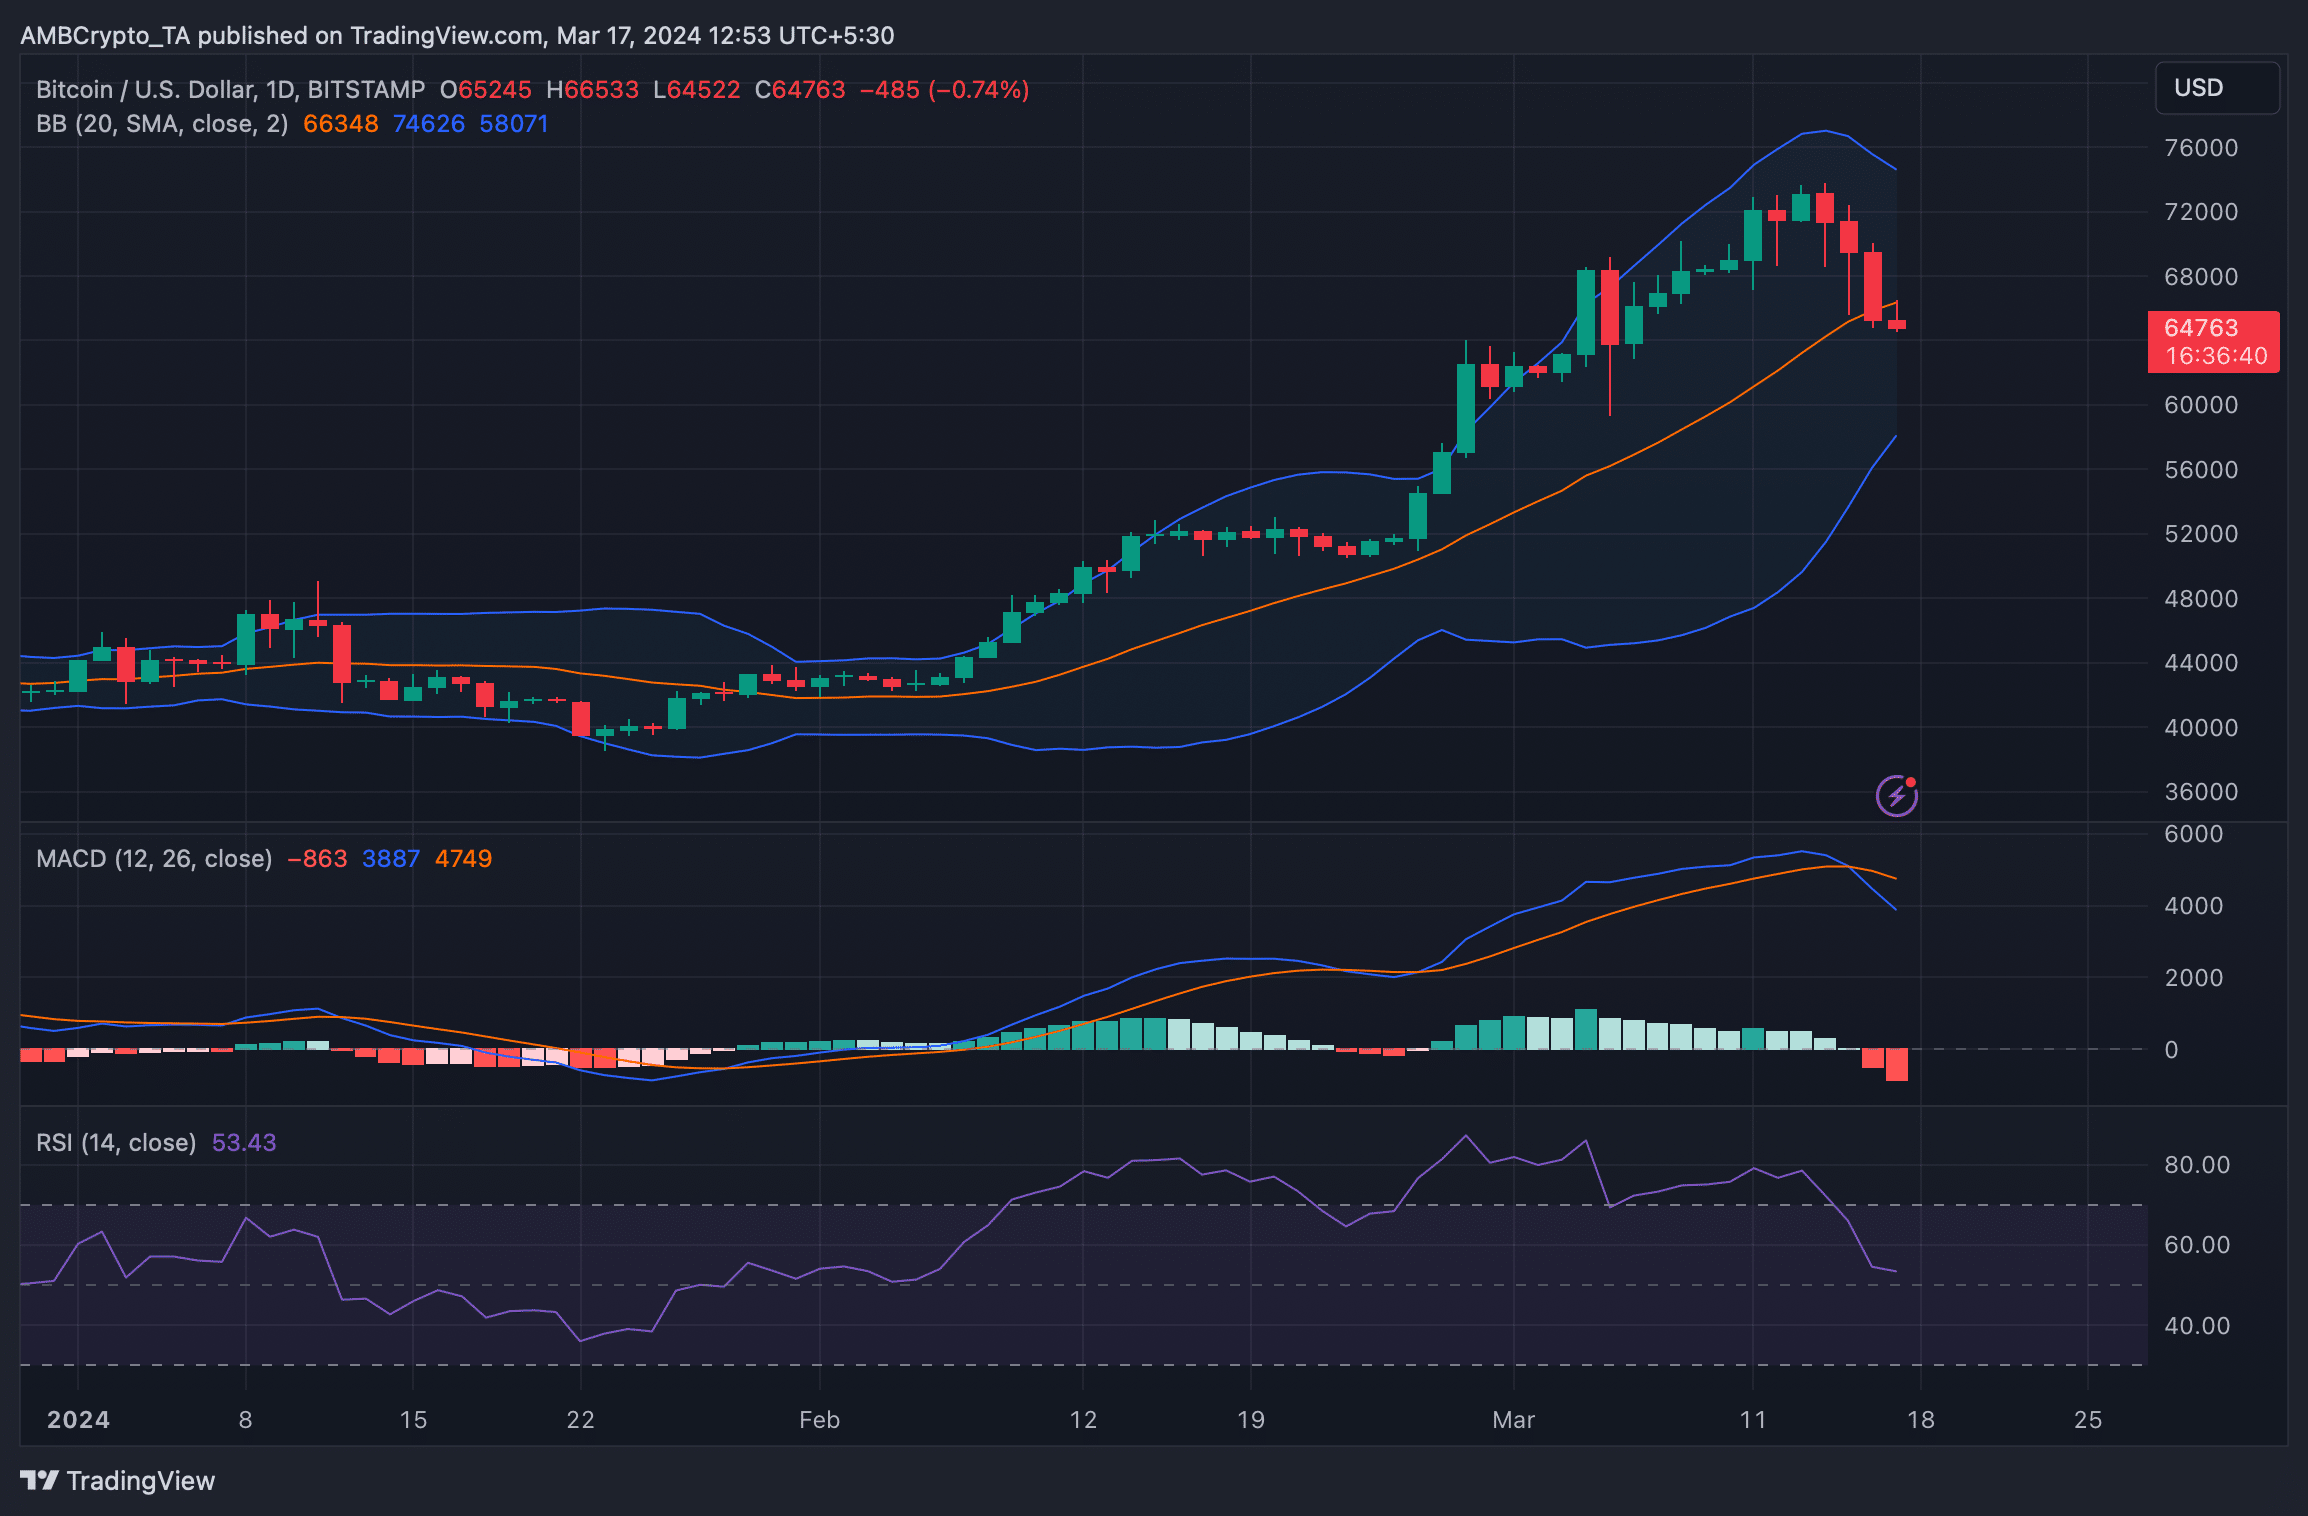
Source: TradingView
- Bitcoin was down by more than 5% in the last 24 hours.
- Market indicators hinted at a continued price decline.
Bitcoin [BTC] continued to witness price corrections, as its value had dropped below the $66K mark at press time.
Though there were several factors at play, miners’ behavior might have impacted the king of cryptos’ price more negatively than investors realized.
Bitcoin miners are selling
BTC turned bearish in the recent past as its value dropped by over 5% in the last seven days. In the last 24 hours alone, BTC’s price witnessed yet another 5% correction.
According to CoinMarketCap, at the time of writing, BTC was trading at $64,953.22, with a market capitalization of over $1.2 trillion.
In the meantime, CryptoOnchain, an author and analyst at CryptoQuant, posted an analysis pointing out that BTC’s miners’ reserves were dropping.
To be precise, miners’ reserves have reached their lowest level since April 2021, meaning that miners were selling their holdings.
The analysis mentioned that this decline has been followed by a much steeper slope since the beginning of November, which might have been one of the reasons for increasing sales pressure in the market.
Source: CryptoQuant
To check whether selling pressure was high overall, AMBCrypto took a look at CryptoQuant’s data.
Our analysis revealed that BTC’s net deposit on exchanges was high compared to the last seven-day average, suggesting high selling pressure.
BTC’s aSOPR was in the red, meaning that more investors were selling at a profit at press time.
The king coin’s Binary CDD was also in the red, hinting that long-term holders’ movements in the last seven days were higher than average.
Source: CryptoQuant
Market sentiment looked bearish, as evident by Bitcoin’s Coinbase Premium. Notably, the metric revealed that selling sentiment was dominant among U.S. investors.
Its Korea Premium was also in the red, indicating that Korean investors were selling BTC, adding to the overall selling pressure.
Source: CryptoQuant
Is a further downtrend on its way?
AMBCrypto’s analysis of Bitcoin’s daily chart suggested that the possibility of a further price decline was high. As per the Bollinger Bands, BTC’s rice went under its 20-day simple moving average (SMA).
Read Bitcoin’s [BTC] Price Prediction 2024-25
Its MACD displayed a bearish crossover as well.
Further, Bitcoin’s Relative Strength Index (RSI) registered a sharp downtick at press time, hinting at a continued southward price movement.
Source: TradingView


get generic clomiphene without insurance clomid tablets price uk can i purchase cheap clomiphene for sale clomid at clicks how to buy generic clomiphene no prescription cheapest clomid pills where to buy clomid pill
Thanks towards putting this up. It’s evidently done.
More posts like this would make the online elbow-room more useful.
zithromax 250mg ca – buy zithromax 250mg online order metronidazole 400mg pill
rybelsus pills – periactin 4mg uk buy periactin online cheap
order motilium generic – domperidone 10mg without prescription flexeril 15mg us
inderal 10mg without prescription – buy generic methotrexate order methotrexate 10mg online