Ethereum faced its worst start in a decade with a 47% Q1 drop and sell-side dominance.
ETH struggled with exhaustion and lackluster recovery, making a rebound to its all-time high uncertain.
Ethereum [ETH] has had a rough start to 2025, facing its worst performance in a decade with a 47% drop in the first three months.
The heavy selling pressure surrounding ETH has raised serious doubts about its ability to recover, leaving many investors questioning if it can regain its all-time high later this year.
ETH’s worst Q1 in 10 years
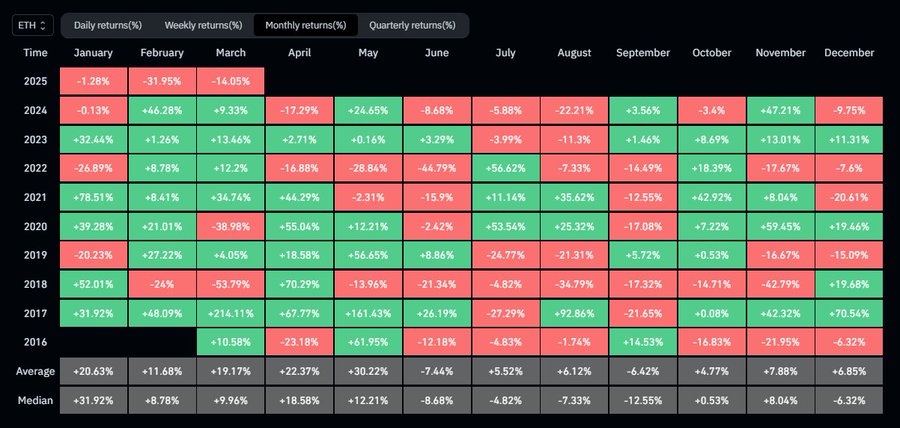
For the first time in the last ten years, Ethereum has posted three consecutive months of losses to kick off a calendar year. From January to March 2025,
ETH has dropped a staggering 47.63%, marking its worst Q1 on record. The decline began with a modest -1.28% in January, worsened dramatically to -31.95% in February, and extended into March with another -14.05%.
Source: X
This rare triple-red quarter not only breaks ETH’s historical trend of stronger early-year performance but also places it far below the average Q1 gain of +30.22% seen across previous years.
The data underscores how out of sync 2025 is with Ethereum’s usual seasonal pattern, raising serious uncertainty about its future trajectory.
The red zone has never persisted this deep or for this long, not even during prior bear markets. This capitulation-level selling pressure signals a serious crisis of confidence for ETH.
With liquidity dwindling and buyers remaining scarce, reclaiming its all-time high in 2025 now appears more challenging than ever.
Ethereum shows signs of exhaustion, but no strong reversal yet
Ethereum’s recent price action remains around $1,900, reflecting minimal gains and a lack of strong momentum. At press time, the RSI was at 35, indicating that ETH was near oversold territory but has yet to experience a clear recovery bounce.
Additionally, the OBV remained flat, highlighting subdued buying interest despite a reduction in selling pressure.
Source: TradingView
The MACD indicator revealed a narrowing gap between the MACD and signal lines, suggesting weakening bearish momentum. However, the histogram remains negative, signaling that bulls have yet to regain control.
Ethereum needs a decisive break above the $2,000 mark, supported by strong trading volume, to escape its current range. Without this, the price may remain range-bound or risk sliding further.
For now, Ethereum’s trend remains cautious and lacks the strength for a sustained breakout.
Next: Bitcoin eyes $126K by June as data sparks bull market comeback
Ethereum faced its worst start in a decade with a 47% Q1 drop and sell-side dominance.
ETH struggled with exhaustion and lackluster recovery, making a rebound to its all-time high uncertain.
Ethereum [ETH] has had a rough start to 2025, facing its worst performance in a decade with a 47% drop in the first three months.
The heavy selling pressure surrounding ETH has raised serious doubts about its ability to recover, leaving many investors questioning if it can regain its all-time high later this year.
For the first time in the last ten years, Ethereum has posted three consecutive months of losses to kick off a calendar year. From January to March 2025,
ETH has dropped a staggering 47.63%, marking its worst Q1 on record. The decline began with a modest -1.28% in January, worsened dramatically to -31.95% in February, and extended into March with another -14.05%.
Source: X
This rare triple-red quarter not only breaks ETH’s historical trend of stronger early-year performance but also places it far below the average Q1 gain of +30.22% seen across previous years.
The data underscores how out of sync 2025 is with Ethereum’s usual seasonal pattern, raising serious uncertainty about its future trajectory.
The red zone has never persisted this deep or for this long, not even during prior bear markets. This capitulation-level selling pressure signals a serious crisis of confidence for ETH.
With liquidity dwindling and buyers remaining scarce, reclaiming its all-time high in 2025 now appears more challenging than ever.
Ethereum shows signs of exhaustion, but no strong reversal yet
Ethereum’s recent price action remains around $1,900, reflecting minimal gains and a lack of strong momentum. At press time, the RSI was at 35, indicating that ETH was near oversold territory but has yet to experience a clear recovery bounce.
Additionally, the OBV remained flat, highlighting subdued buying interest despite a reduction in selling pressure.
Source: TradingView
The MACD indicator revealed a narrowing gap between the MACD and signal lines, suggesting weakening bearish momentum. However, the histogram remains negative, signaling that bulls have yet to regain control.
Ethereum needs a decisive break above the $2,000 mark, supported by strong trading volume, to escape its current range. Without this, the price may remain range-bound or risk sliding further.
For now, Ethereum’s trend remains cautious and lacks the strength for a sustained breakout.
Next: Bitcoin eyes $126K by June as data sparks bull market comeback
There are some fascinating cut-off dates on this article however I don’t know if I see all of them center to heart. There’s some validity but I’ll take maintain opinion until I look into it further. Good article , thanks and we want extra! Added to FeedBurner as nicely


![[Latest] South Korea Smart Grid Networking Market: Analyzing Regional Variations and Trends](https://coininsights.com/wp-content/uploads/2025/03/L317414112_g-360x180.jpg)
![[Latest] Market Trends to Watch in the Europe Wireless Sensors Market](https://coininsights.com/wp-content/uploads/2025/03/L317853623_g-360x180.jpg)


![[Latest] North America Safety I/O Modules Market Insights: Key Drivers of Growth and Change](https://coininsights.com/wp-content/uploads/2025/03/L316986664_g-360x180.jpg)


There are some fascinating cut-off dates on this article however I don’t know if I see all of them center to heart. There’s some validity but I’ll take maintain opinion until I look into it further. Good article , thanks and we want extra! Added to FeedBurner as nicely