- Michael Saylor saw Bitcoin as a secure and stable investment.
- Bitcoin’s RSI has formed a bullish divergence on a daily time frame, indicating a trend reversal.
Michael Saylor, the Chairman of MicroStrategy has garnered significant attention from crypto enthusiasts following his recent Bitcoin [BTC] prediction.
On the 10th of September, during an interview with “CNBC Squawk Box,” Saylor made a bold prediction that Bitcoin could reach $13 million by 2045.
Micheal Saylor’s bold prediction
During the interview, Saylor highlighted that BTC represented only 0.1% of global capital, but he believed it could grow to 7%. If this big shift occurs, it could push BTC’s price to $13 million.
Additionally, Saylor pointed out that Bitcoin is unique because it doesn’t rely on any third party, which makes it less risky as compared to other investment products.
While many view Bitcoin as a high-risk investment due to its volatile nature, Saylor argued that it’s actually a safe option for investors who believe in secure and stable investment.
Bitcoin technical analysis and key levels
Despite Saylor’s predictions, which spans 21 years, AMBCrypto‘s current expert technical analysis showed that Bitcoin appeared bullish, despite trading below the 200 Exponential Moving Average (EMA) on the daily timeframe.
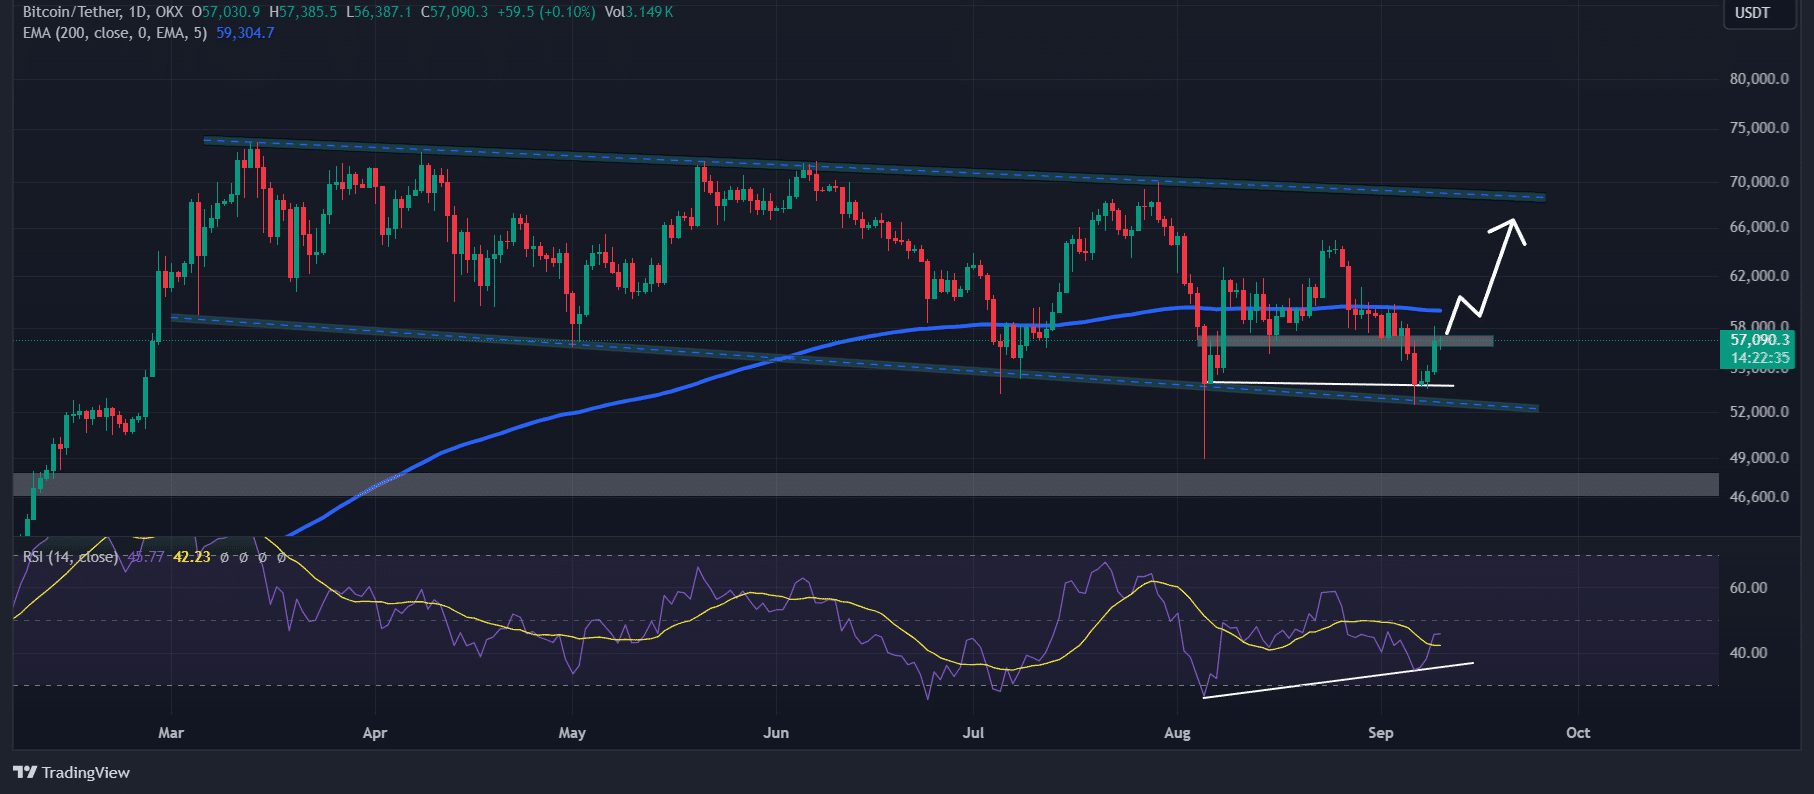
Since March 2024, Bitcoin has been moving within a descending parallel channel, and during this period, the BTC price has touched the lower channel five times.

Source: TradingView
Based on historical data, whenever BTC reaches the lower channel, it tends to experience a price surge of over 20%. We may see a similar surge this time.
However, Bitcoin is currently facing strong resistance near the $57,300 level.
If it breaks out and closes a daily candle above that level, there is a high possibility BTC could soar significantly, and potentially reach $65,000 and $69,000 in the coming days.
Meanwhile, Bitcoin’s Relative Strength Index (RSI) has formed a bullish divergence on a daily time frame, indicating a trend reversal from a downtrend to an uptrend.
Bullish on-chain metrics
On-chain metrics also support this bullish outlook. Coinglass’s BTC Long/Short ratio stood at +1.039 at press time, reflecting a positive sentiment among bullish traders over the last 24 hours.
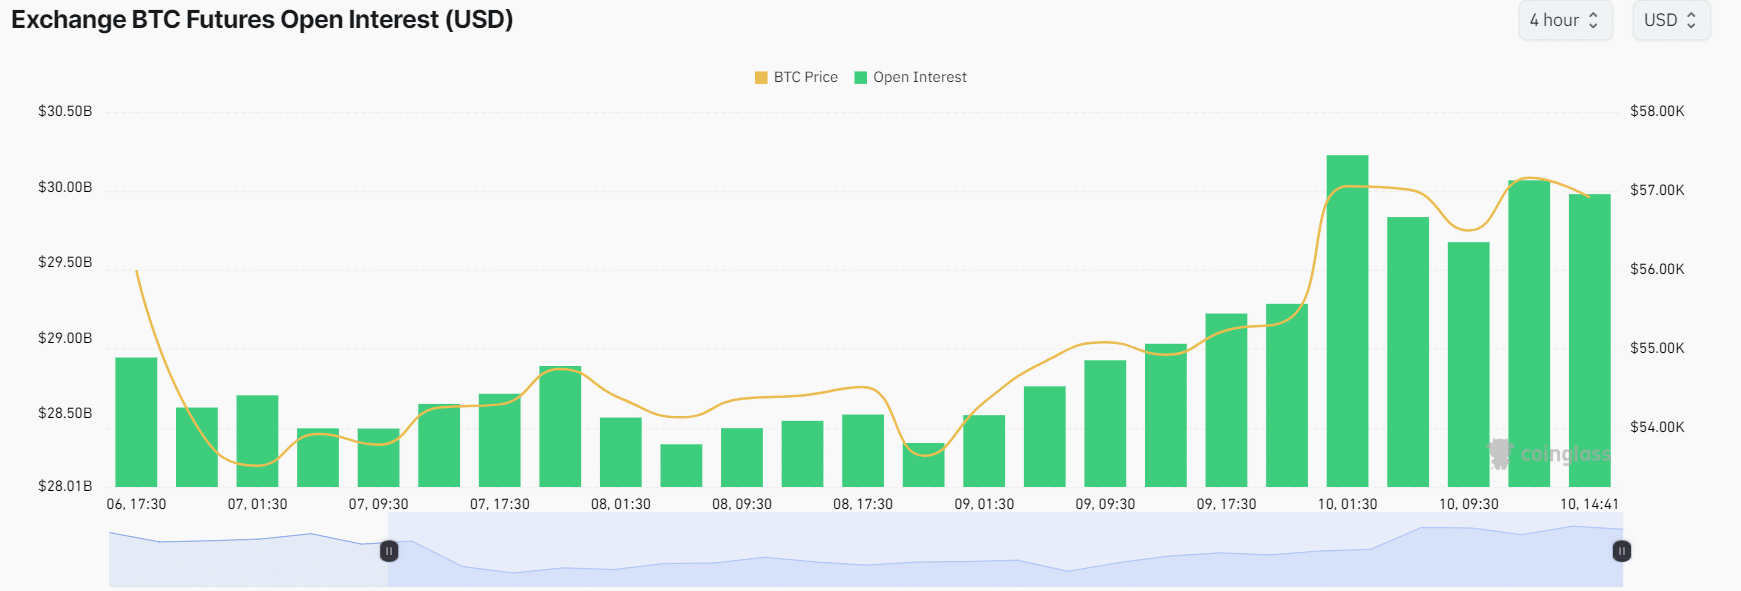
BTC’s Future Open Interest has increased by over 3% during the same period and has been rising steadily for the past few days.

Source: Coinglass
A positive long/short ratio and high Open Interest suggests potential buying opportunities. Traders often use this combination to build their positions.

Source: Coinglass
Read Bitcoin’s [BTC] Price Prediction 2024–2025
At press time, BTC was trading near the $57,000 level, having experienced a price surge of over 3% in the last 24 hours.
Its trading volume has skyrocketed by 46% during the same period, indicating higher participation from crypto enthusiasts amid price recovery.
- Michael Saylor saw Bitcoin as a secure and stable investment.
- Bitcoin’s RSI has formed a bullish divergence on a daily time frame, indicating a trend reversal.
Michael Saylor, the Chairman of MicroStrategy has garnered significant attention from crypto enthusiasts following his recent Bitcoin [BTC] prediction.
On the 10th of September, during an interview with “CNBC Squawk Box,” Saylor made a bold prediction that Bitcoin could reach $13 million by 2045.
Micheal Saylor’s bold prediction
During the interview, Saylor highlighted that BTC represented only 0.1% of global capital, but he believed it could grow to 7%. If this big shift occurs, it could push BTC’s price to $13 million.
Additionally, Saylor pointed out that Bitcoin is unique because it doesn’t rely on any third party, which makes it less risky as compared to other investment products.
While many view Bitcoin as a high-risk investment due to its volatile nature, Saylor argued that it’s actually a safe option for investors who believe in secure and stable investment.
Bitcoin technical analysis and key levels
Despite Saylor’s predictions, which spans 21 years, AMBCrypto‘s current expert technical analysis showed that Bitcoin appeared bullish, despite trading below the 200 Exponential Moving Average (EMA) on the daily timeframe.
Since March 2024, Bitcoin has been moving within a descending parallel channel, and during this period, the BTC price has touched the lower channel five times.

Source: TradingView
Based on historical data, whenever BTC reaches the lower channel, it tends to experience a price surge of over 20%. We may see a similar surge this time.
However, Bitcoin is currently facing strong resistance near the $57,300 level.
If it breaks out and closes a daily candle above that level, there is a high possibility BTC could soar significantly, and potentially reach $65,000 and $69,000 in the coming days.
Meanwhile, Bitcoin’s Relative Strength Index (RSI) has formed a bullish divergence on a daily time frame, indicating a trend reversal from a downtrend to an uptrend.
Bullish on-chain metrics
On-chain metrics also support this bullish outlook. Coinglass’s BTC Long/Short ratio stood at +1.039 at press time, reflecting a positive sentiment among bullish traders over the last 24 hours.
BTC’s Future Open Interest has increased by over 3% during the same period and has been rising steadily for the past few days.

Source: Coinglass
A positive long/short ratio and high Open Interest suggests potential buying opportunities. Traders often use this combination to build their positions.

Source: Coinglass
Read Bitcoin’s [BTC] Price Prediction 2024–2025
At press time, BTC was trading near the $57,000 level, having experienced a price surge of over 3% in the last 24 hours.
Its trading volume has skyrocketed by 46% during the same period, indicating higher participation from crypto enthusiasts amid price recovery.


I’m really impressed along with your writing abilities as smartly as with the layout in your blog. Is this a paid subject or did you modify it your self? Either way stay up the nice high quality writing, it’s rare to see a nice weblog like this one today!
where can i get clomid price how to get cheap clomid without prescription buy cheap clomiphene without prescription where to buy generic clomid pill can i order clomiphene pills where to buy generic clomiphene price where buy clomiphene without prescription
More articles like this would pretence of the blogosphere richer.
More delight pieces like this would make the web better.
order rybelsus 14 mg generic – purchase rybelsus order cyproheptadine for sale
purchase domperidone online cheap – buy flexeril without a prescription cyclobenzaprine without prescription
zithromax 500mg usa – buy azithromycin pills order bystolic generic
augmentin 1000mg sale – https://atbioinfo.com/ buy generic ampicillin
order esomeprazole 20mg sale – anexa mate esomeprazole price
order warfarin for sale – anticoagulant cozaar 50mg brand
order mobic – https://moboxsin.com/ order meloxicam pill
deltasone 20mg brand – apreplson.com deltasone 10mg ca
home remedies for ed erectile dysfunction – buy ed pills online buying ed pills online
amoxicillin canada – comba moxi how to buy amoxil
buy diflucan 200mg generic – brand fluconazole 100mg forcan cost
lexapro 10mg brand – click escitalopram for sale
cenforce pills – https://cenforcers.com/ cenforce 100mg usa
para que sirve las tabletas cialis tadalafil de 5mg – https://strongtadafl.com/# cialis canada free sample
ranitidine tablet – zantac 300mg ca zantac 150mg usa
buy viagra soft tabs – sildenafil 50mg cost want buy cheap viagra
This is the kind of topic I have reading. comprar cenforce en espaГ±a
Greetings! Jolly useful advice within this article! It’s the crumb changes which liking turn the largest changes. Thanks a a quantity quest of sharing! https://buyfastonl.com/amoxicillin.html
I couldn’t hold back commenting. Warmly written! https://ursxdol.com/prednisone-5mg-tablets/
More articles like this would pretence of the blogosphere richer. https://prohnrg.com/product/loratadine-10-mg-tablets/
The thoroughness in this section is noteworthy. https://aranitidine.com/fr/ciagra-professional-20-mg/
Thanks on sharing. It’s outstrip quality. https://ondactone.com/simvastatin/