


Ethereum, the second-largest cryptocurrency by market capitalization, is currently at a critical juncture as its price enters a consolidation phase. This period of price stability, marked by a narrow trading range, has left traders and investors in a state of uncertainty.
With Ethereum’s price hovering around key support and resistance levels, market participants are closely monitoring technical indicators and market signals to anticipate the next move. The current consolidation reflects a balance between bullish optimism and bearish caution, creating an environment of indecision that could lead to significant volatility once a breakout direction is established.
This analysis delves into examining Ethereum’s current price state to determine its potential future price action.
Market Overview: Ethereum Current Trends And Analysis
Currently, on the 4-hour chart, the price of Ethereum is moving upward toward the upper level of the consolidation zone, but it is still trading below the 100-day Simple Moving Average (SMA).
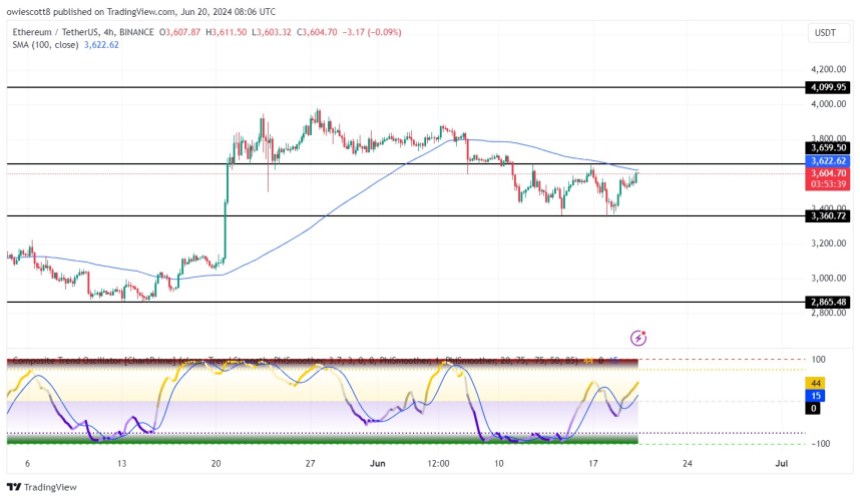
A careful examination of the 4-hour Composite Trend Oscillator reveals that ETH’s price may still move upward as both the signal line and the SMA of the indicator are trending above the zero line. From this formation, it can be suggested that Ethereum may likely move to test the upper base of the consolidation before dropping again.
On the 1-day chart, ETH is actively bullish moving toward the upper base of the consolidation zone while still trading above the 100-day SMA. With the way ETH’s price is moving, it may move on to test the upper base of the consolidation.
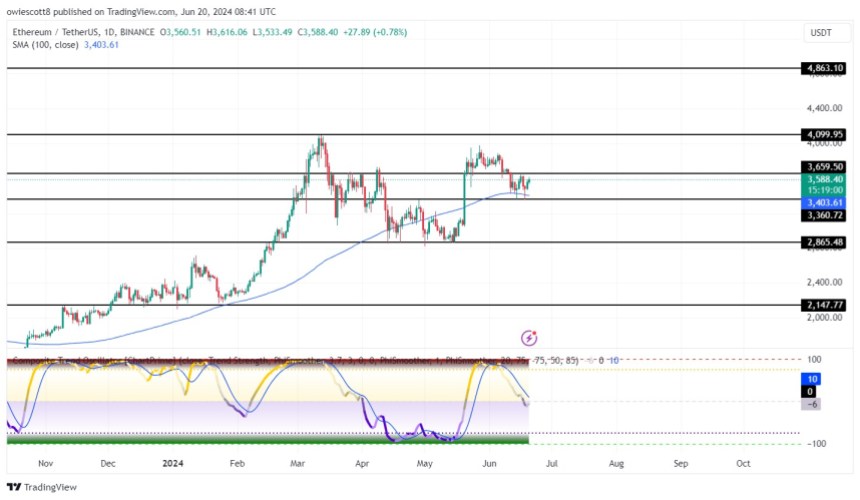
The 1-day Composite Trend Oscillator indicator reveals that although ETH is currently bullish, it may go bearish in the long run as both the signal line and the SMA are attempting to cross below the zero line.
Potential Scenarios: What’s Next For ETH?
A look at potential future scenarios for Ethereum’s movement post-consolidation suggests that if the price of ETH breaks above the upper base of the consolidation, it will begin to move upward toward the $4,099 resistance level. If the price breaches this level, it may move on to test its all-time high of $4,863.
In contrast, should the crypto asset break below the lower base of the consolidation, it will begin to move downward toward the $2,865 support level. If this level is breached, it will continue to move downward to test the $2,147 and probably other lower levels.
As of the time of writing, ETH was trading at around $3,607 and was down by 1.82% with a market capitalization of over $440 billion and a 24-hour trading volume of over $13 billion. Although its market capitalization is down by 1.77%, its trading volume has increased by 28.93% in the past day.
Featured image from Adobe Stock, chart from Tradingview.com
Ethereum, the second-largest cryptocurrency by market capitalization, is currently at a critical juncture as its price enters a consolidation phase. This period of price stability, marked by a narrow trading range, has left traders and investors in a state of uncertainty.
With Ethereum’s price hovering around key support and resistance levels, market participants are closely monitoring technical indicators and market signals to anticipate the next move. The current consolidation reflects a balance between bullish optimism and bearish caution, creating an environment of indecision that could lead to significant volatility once a breakout direction is established.
This analysis delves into examining Ethereum’s current price state to determine its potential future price action.
Market Overview: Ethereum Current Trends And Analysis
Currently, on the 4-hour chart, the price of Ethereum is moving upward toward the upper level of the consolidation zone, but it is still trading below the 100-day Simple Moving Average (SMA).
A careful examination of the 4-hour Composite Trend Oscillator reveals that ETH’s price may still move upward as both the signal line and the SMA of the indicator are trending above the zero line. From this formation, it can be suggested that Ethereum may likely move to test the upper base of the consolidation before dropping again.
On the 1-day chart, ETH is actively bullish moving toward the upper base of the consolidation zone while still trading above the 100-day SMA. With the way ETH’s price is moving, it may move on to test the upper base of the consolidation.
The 1-day Composite Trend Oscillator indicator reveals that although ETH is currently bullish, it may go bearish in the long run as both the signal line and the SMA are attempting to cross below the zero line.
Potential Scenarios: What’s Next For ETH?
A look at potential future scenarios for Ethereum’s movement post-consolidation suggests that if the price of ETH breaks above the upper base of the consolidation, it will begin to move upward toward the $4,099 resistance level. If the price breaches this level, it may move on to test its all-time high of $4,863.
In contrast, should the crypto asset break below the lower base of the consolidation, it will begin to move downward toward the $2,865 support level. If this level is breached, it will continue to move downward to test the $2,147 and probably other lower levels.
As of the time of writing, ETH was trading at around $3,607 and was down by 1.82% with a market capitalization of over $440 billion and a 24-hour trading volume of over $13 billion. Although its market capitalization is down by 1.77%, its trading volume has increased by 28.93% in the past day.
Featured image from Adobe Stock, chart from Tradingview.com


can i buy generic clomiphene tablets buying generic clomiphene without prescription where to get clomiphene price get clomiphene without a prescription cost of cheap clomid for sale can you buy generic clomiphene prices buying clomid pill
This website absolutely has all of the bumf and facts I needed adjacent to this subject and didn’t know who to ask.
The thoroughness in this piece is noteworthy.
buy generic zithromax over the counter – sumycin ca purchase metronidazole online cheap
order motilium 10mg generic – buy sumycin tablets order cyclobenzaprine generic
inderal 20mg pills – inderal for sale order methotrexate pill
amoxicillin uk – buy ipratropium 100mcg sale ipratropium sale
cost zithromax 250mg – azithromycin medication order bystolic 20mg online cheap
buy amoxiclav pill – https://atbioinfo.com/ acillin uk
nexium 40mg uk – anexa mate buy nexium 20mg generic
coumadin 5mg sale – https://coumamide.com/ hyzaar pills
how to buy mobic – https://moboxsin.com/ meloxicam cheap
deltasone 40mg uk – https://apreplson.com/ buy deltasone 40mg sale
buy ed pills sale – ed pills that work quickly low cost ed pills
amoxicillin without prescription – amoxicillin usa amoxil price
buy diflucan 100mg without prescription – https://gpdifluca.com/ diflucan online order
order generic cenforce – https://cenforcers.com/ order cenforce 50mg for sale
cialis information – ciltad gn cialis black in australia
buy ranitidine 150mg for sale – https://aranitidine.com/# ranitidine 300mg for sale
More posts like this would add up to the online space more useful. https://gnolvade.com/
buy viagra professional online no prescription – https://strongvpls.com/ order viagra with no prescription online
Thanks on putting this up. It’s understandably done. https://ursxdol.com/ventolin-albuterol/
Greetings! Very useful par‘nesis within this article! It’s the crumb changes which will make the largest changes. Thanks a a quantity in the direction of sharing! https://buyfastonl.com/isotretinoin.html
The thoroughness in this section is noteworthy. https://aranitidine.com/fr/sibelium/