


UNI price started a major increase above the $10.50 resistance. Uniswap is showing positive signs and might eye more upsides above the $12.00 resistance.
- UNI started a fresh increase above the $10.50 resistance zone.
- The price is trading above $11.20 and the 100-hourly simple moving average.
- There was a break above a key bearish trend line with resistance near $10.35 on the hourly chart of the UNI/USD pair (data source from Kraken).
- The pair might correct gains, but the bulls might eye more upsides above $12.00 in the near term.
UNI Price Regains Traction
After forming a base above the $9.20 level, Uniswap started a fresh increase like Bitcoin and Ethereum. UNI price gained pace for a move above the $9.80 and $10.00 resistance levels.
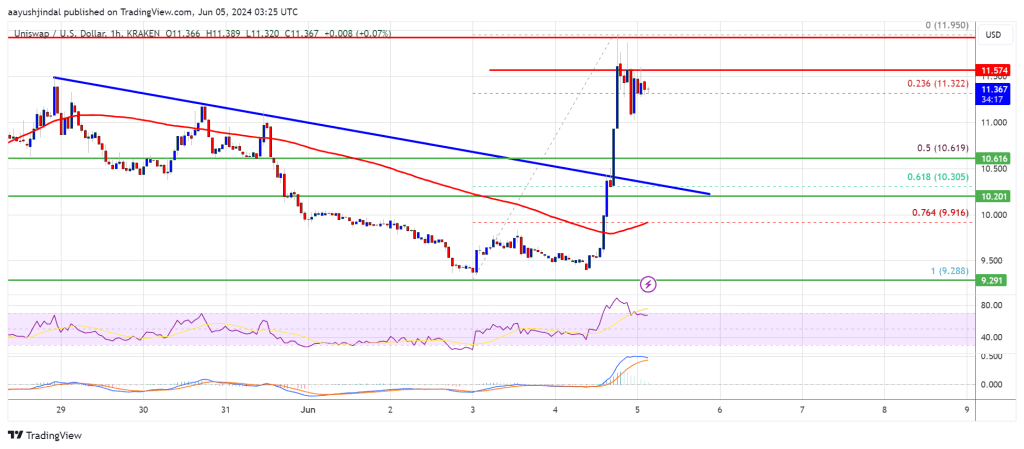
There was a break above a key bearish trend line with resistance near $10.35 on the hourly chart of the UNI/USD pair. The bulls even pushed the price above the $10.50 and $11.50 resistance levels. Finally, the bears appeared near the $12.00 zone.
A high was formed near $11.795 and the price is now consolidating gains near the 23.6% Fib retracement level of the upward move from the $9.28 swing low to the $11.95 high.
UNI is now trading above $11.20 and the 100-hourly simple moving average. Immediate resistance is near the $11.55 level. The next key resistance is near the $12.00 level. A close above the $12.00 level could open the doors for more gains in the near term.
The next key resistance could be near $12.20, above which the bulls are likely to aim a test of the $12.50 level. Any more gains might send UNI toward $13.50.
Are Dips Supported In Uniswap?
If UNI price fails to climb above $11.95 or $12.00, it could start a downside correction. The first major support is near the $11.00 level.
The next major support is near the $10.60 level or the 50% Fib retracement level of the upward move from the $9.28 swing low to the $11.95 high. A downside break below the $10.60 support might open the doors for a push toward $10.20.
Technical Indicators
Hourly MACD – The MACD for UNI/USD is gaining momentum in the bullish zone.
Hourly RSI (Relative Strength Index) – The RSI for UNI/USD is above the 50 level.
Major Support Levels – $11.00, $10.60, and $10.20.
Major Resistance Levels – $11.55, $12.00, and $12.20.
UNI price started a major increase above the $10.50 resistance. Uniswap is showing positive signs and might eye more upsides above the $12.00 resistance.
- UNI started a fresh increase above the $10.50 resistance zone.
- The price is trading above $11.20 and the 100-hourly simple moving average.
- There was a break above a key bearish trend line with resistance near $10.35 on the hourly chart of the UNI/USD pair (data source from Kraken).
- The pair might correct gains, but the bulls might eye more upsides above $12.00 in the near term.
UNI Price Regains Traction
After forming a base above the $9.20 level, Uniswap started a fresh increase like Bitcoin and Ethereum. UNI price gained pace for a move above the $9.80 and $10.00 resistance levels.
There was a break above a key bearish trend line with resistance near $10.35 on the hourly chart of the UNI/USD pair. The bulls even pushed the price above the $10.50 and $11.50 resistance levels. Finally, the bears appeared near the $12.00 zone.
A high was formed near $11.795 and the price is now consolidating gains near the 23.6% Fib retracement level of the upward move from the $9.28 swing low to the $11.95 high.
UNI is now trading above $11.20 and the 100-hourly simple moving average. Immediate resistance is near the $11.55 level. The next key resistance is near the $12.00 level. A close above the $12.00 level could open the doors for more gains in the near term.
The next key resistance could be near $12.20, above which the bulls are likely to aim a test of the $12.50 level. Any more gains might send UNI toward $13.50.
Are Dips Supported In Uniswap?
If UNI price fails to climb above $11.95 or $12.00, it could start a downside correction. The first major support is near the $11.00 level.
The next major support is near the $10.60 level or the 50% Fib retracement level of the upward move from the $9.28 swing low to the $11.95 high. A downside break below the $10.60 support might open the doors for a push toward $10.20.
Technical Indicators
Hourly MACD – The MACD for UNI/USD is gaining momentum in the bullish zone.
Hourly RSI (Relative Strength Index) – The RSI for UNI/USD is above the 50 level.
Major Support Levels – $11.00, $10.60, and $10.20.
Major Resistance Levels – $11.55, $12.00, and $12.20.


where to buy clomiphene price buying cheap clomiphene pill can i purchase cheap clomiphene without rx can i get generic clomid prices get generic clomid without rx can you get clomid without rx order generic clomiphene for sale
More posts like this would make the online elbow-room more useful.
More text pieces like this would insinuate the интернет better.
rybelsus medication – rybelsus 14mg pills brand periactin 4mg
order domperidone 10mg pill – sumycin ca cyclobenzaprine 15mg uk
purchase inderal pill – plavix us order methotrexate pill
order amoxil without prescription – amoxicillin for sale cost ipratropium 100mcg
order augmentin online – atbio info buy ampicillin generic
order esomeprazole online – https://anexamate.com/ order nexium 20mg capsules
brand meloxicam 15mg – https://moboxsin.com/ buy meloxicam without prescription
cheapest ed pills – erection problems best drug for ed
buy diflucan no prescription – order generic fluconazole 200mg order fluconazole 100mg generic
where to buy cenforce without a prescription – cenforce 50mg sale cenforce buy online
sildenafil vs tadalafil which is better – https://ciltadgn.com/ cialis soft tabs
zantac ca – site order ranitidine without prescription
when is generic cialis available – https://strongtadafl.com/# cialis 20 mg duration
Thanks an eye to sharing. It’s first quality. https://gnolvade.com/
generic viagra 50mg – https://strongvpls.com/ buy female viagra
I’ll certainly return to read more. https://ursxdol.com/synthroid-available-online/
More articles like this would frame the blogosphere richer. https://buyfastonl.com/isotretinoin.html
Palatable blog you be undergoing here.. It’s obdurate to assign high worth article like yours these days. I truly respect individuals like you! Rent guardianship!! https://prohnrg.com/product/cytotec-online/
This is the stripe of content I have reading. https://aranitidine.com/fr/levitra_francaise/
This is the amicable of serenity I enjoy reading. https://ondactone.com/product/domperidone/