


![What Is Asset Tokenization? Types, Why It Matters Now [2025]](https://coininsights.com/wp-content/uploads/2025/05/asset_tokenization-360x180.png)


- Solana’s price is likely to reach $153 if the key support level is broken at around $159.
- Bearish momentum for Solana was confirmed by on-chain metrics and the technical indicators.
Solana [SOL] price was consolidating at press time to form a pennant pattern after a significant upward surge in the last three months. Solana was showing a bearish momentum despite the bullish pattern.
The price is accumulating in a bearish movement toward the resistance level that turned to a support at $159. If this support level is broken, the price could plunge further to fill the fair value gap at around $153.
As of this writing, according to coinmarketcap, Solana’s price was at $168 indicating a 0.68% increase in the last 24 hours and a 1.3% increase in the last seven days.
Its market cap stands at around $77 billion while trading volume stands at $77.2 billion, a 12.4% increase in the last 24 hours.
Despite the price having a slight rise, the bullish momentum is diminishing.
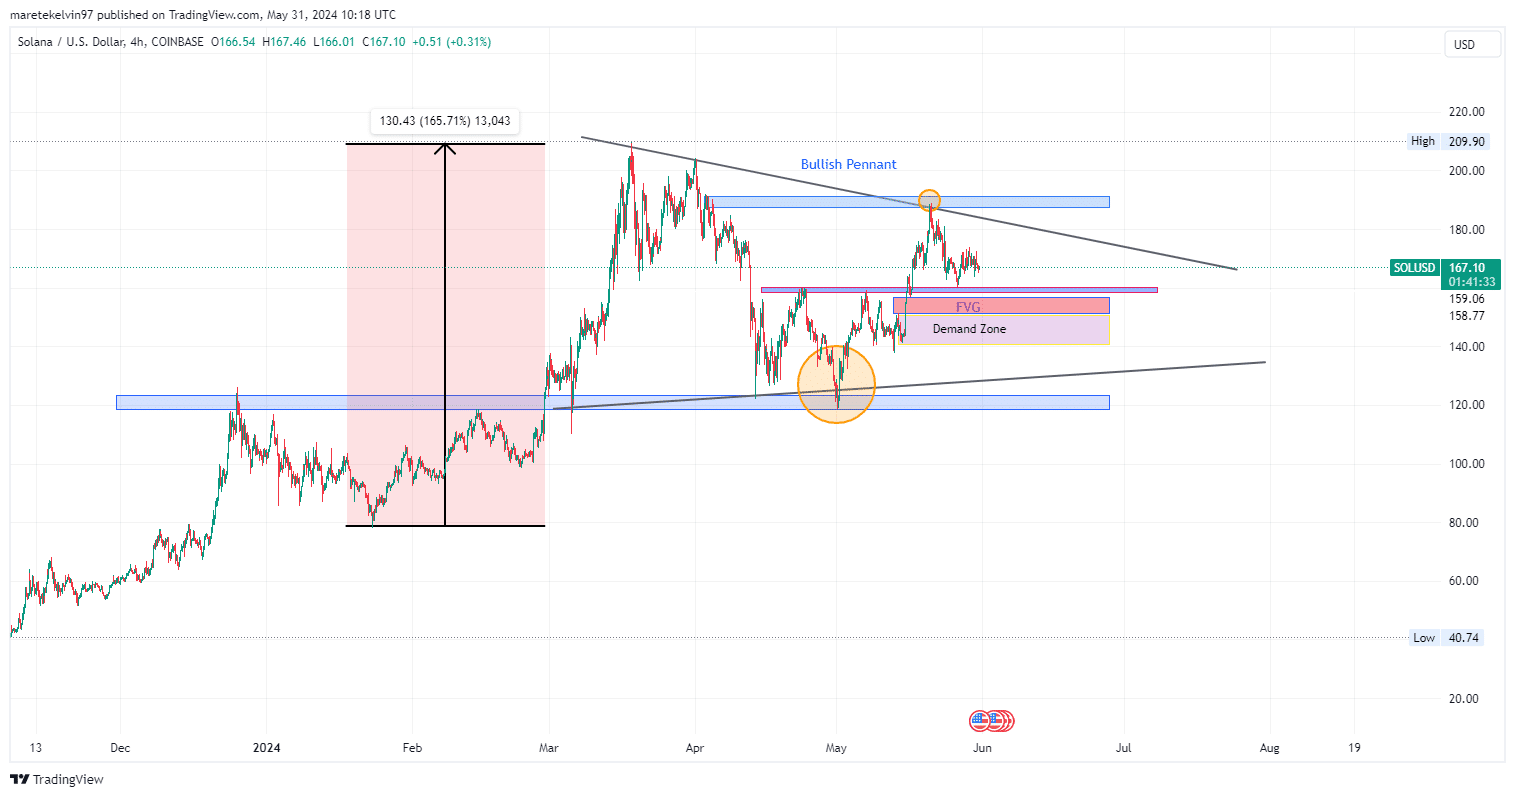
Source: Trading view
Are the metrics signaling bearish sentiments?
AMBCrypto analysed the Santiment social volume indicator and found an increased volume in the short-term and a predominantly decreasing volume trend. The metrics align with the bearish momentum on the SOL price .
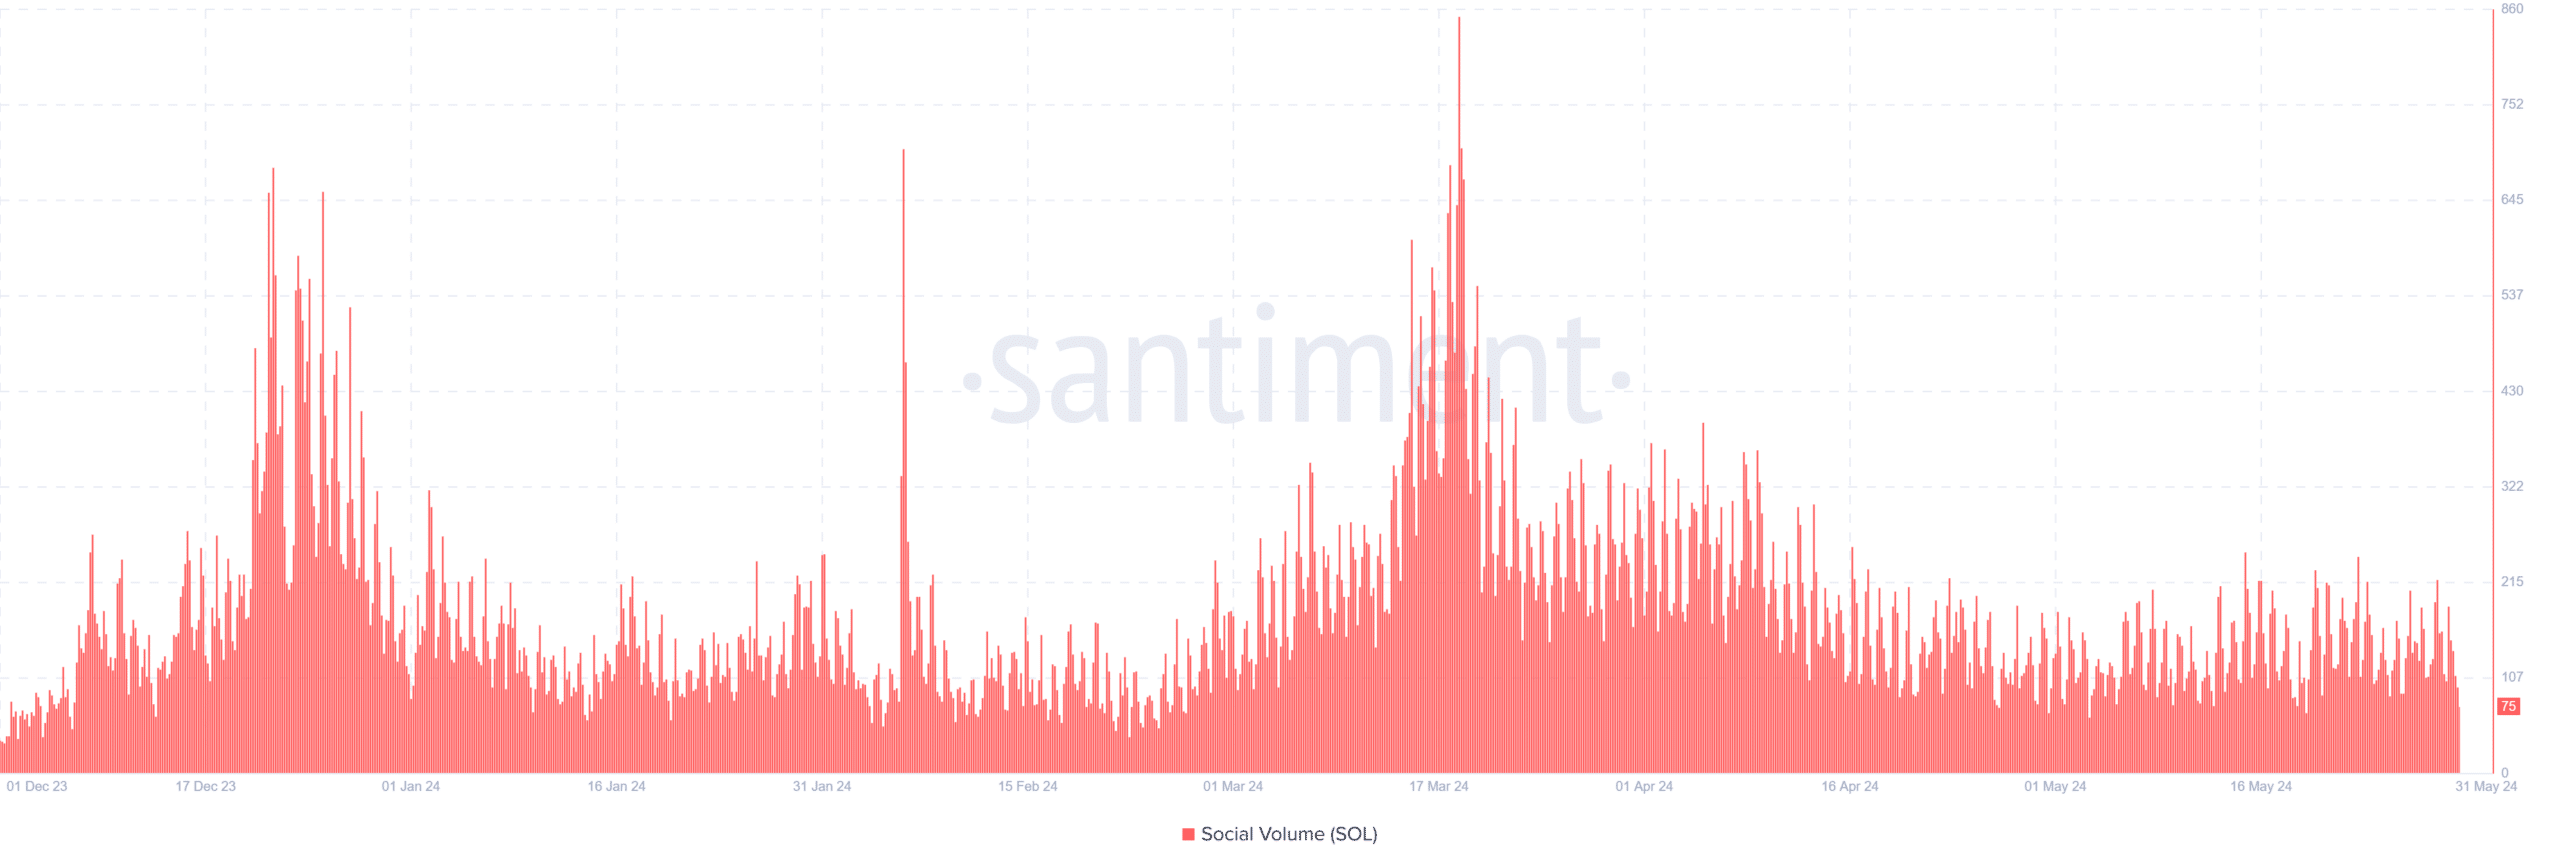
Source: Santiment
AMBCrypto further analysed the long/short ratio from coinglass which indicated more short positions than long positions for Solana. The ratio indicates that investors are anticipating a further plunge in price which affirm the bearish pattern.
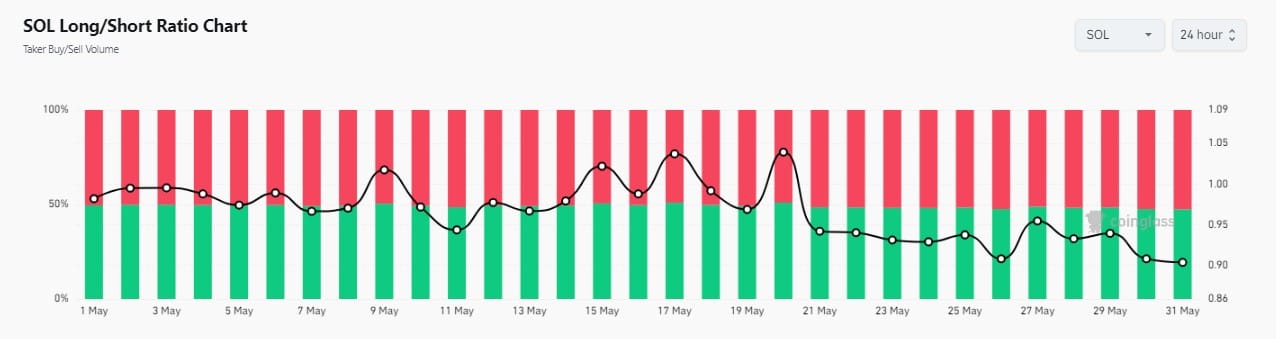
Source: Coinglass
Tradingview chart indicator MACD indicated a bearish momentum on SOL that could break the $159 support level and drop to $153.
The MACD line below the signal line indicated a bearish crossover with the large negative histogram bars affirming the downward price momentum.
The stochastic RSI(34.4)is not within the limits but it is leaning towards the the lower bound indicating a neutral to slightly oversold market.
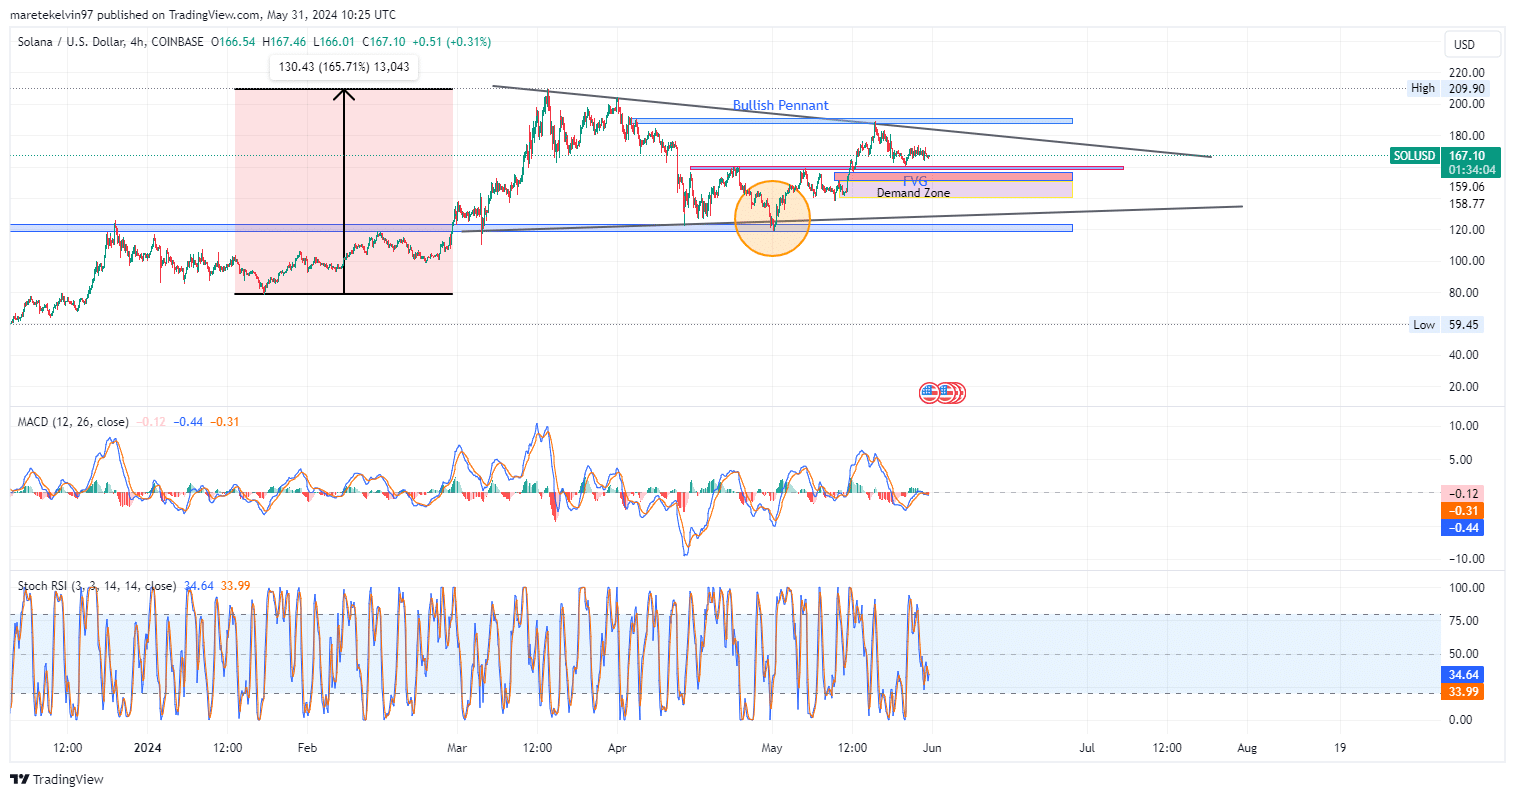
Source: Tradingview
Is your portfolio green? Check out the SOL Profit Calculator
Technical indicators and on chain analysis align to indicate a possible bearish momentum to the fair value gap at $153.
MACD showed declining momentum which was confirmed by the Stochastic RSI. However, if the price fails to break the support level, a possible bullish run is likely.
- Solana’s price is likely to reach $153 if the key support level is broken at around $159.
- Bearish momentum for Solana was confirmed by on-chain metrics and the technical indicators.
Solana [SOL] price was consolidating at press time to form a pennant pattern after a significant upward surge in the last three months. Solana was showing a bearish momentum despite the bullish pattern.
The price is accumulating in a bearish movement toward the resistance level that turned to a support at $159. If this support level is broken, the price could plunge further to fill the fair value gap at around $153.
As of this writing, according to coinmarketcap, Solana’s price was at $168 indicating a 0.68% increase in the last 24 hours and a 1.3% increase in the last seven days.
Its market cap stands at around $77 billion while trading volume stands at $77.2 billion, a 12.4% increase in the last 24 hours.
Despite the price having a slight rise, the bullish momentum is diminishing.
Source: Trading view
Are the metrics signaling bearish sentiments?
AMBCrypto analysed the Santiment social volume indicator and found an increased volume in the short-term and a predominantly decreasing volume trend. The metrics align with the bearish momentum on the SOL price .
Source: Santiment
AMBCrypto further analysed the long/short ratio from coinglass which indicated more short positions than long positions for Solana. The ratio indicates that investors are anticipating a further plunge in price which affirm the bearish pattern.
Source: Coinglass
Tradingview chart indicator MACD indicated a bearish momentum on SOL that could break the $159 support level and drop to $153.
The MACD line below the signal line indicated a bearish crossover with the large negative histogram bars affirming the downward price momentum.
The stochastic RSI(34.4)is not within the limits but it is leaning towards the the lower bound indicating a neutral to slightly oversold market.
Source: Tradingview
Is your portfolio green? Check out the SOL Profit Calculator
Technical indicators and on chain analysis align to indicate a possible bearish momentum to the fair value gap at $153.
MACD showed declining momentum which was confirmed by the Stochastic RSI. However, if the price fails to break the support level, a possible bullish run is likely.


can i order clomid without rx cheap clomid online how can i get clomid without dr prescription how can i get cheap clomid pill how to get cheap clomiphene where can i buy clomiphene without dr prescription can you buy generic clomiphene pills
More peace pieces like this would urge the интернет better.
This is the kind of topic I have reading.
azithromycin for sale online – tindamax uk metronidazole 200mg drug
semaglutide online buy – order semaglutide 14mg generic buy cheap generic cyproheptadine
oral motilium – sumycin 500mg uk purchase cyclobenzaprine pills
order inderal 10mg online cheap – plavix buy online buy cheap generic methotrexate
where to buy amoxil without a prescription – combivent 100mcg cost oral ipratropium