


![What Is Asset Tokenization? Types, Why It Matters Now [2025]](https://coininsights.com/wp-content/uploads/2025/05/asset_tokenization-360x180.png)


- Bitcoin has a bullish market structure on the daily timeframe.
- The significant capital inflow and strong momentum favored an upward move on the daily chart.
Bitcoin [BTC] saw increased demand from ETFs a month after the halving event. An AMBCrypto report noted that the altcoin performance has eclipsed Bitcoin recently.
Another AMBCrypto analysis drew parallels between the 2020 post-halving and current trends. The Rainbow Chart showed that BTC was still in the buy zone – does the Bitcoin price prediction agree?
Bitcoin bulls are not willing to force the issue yet

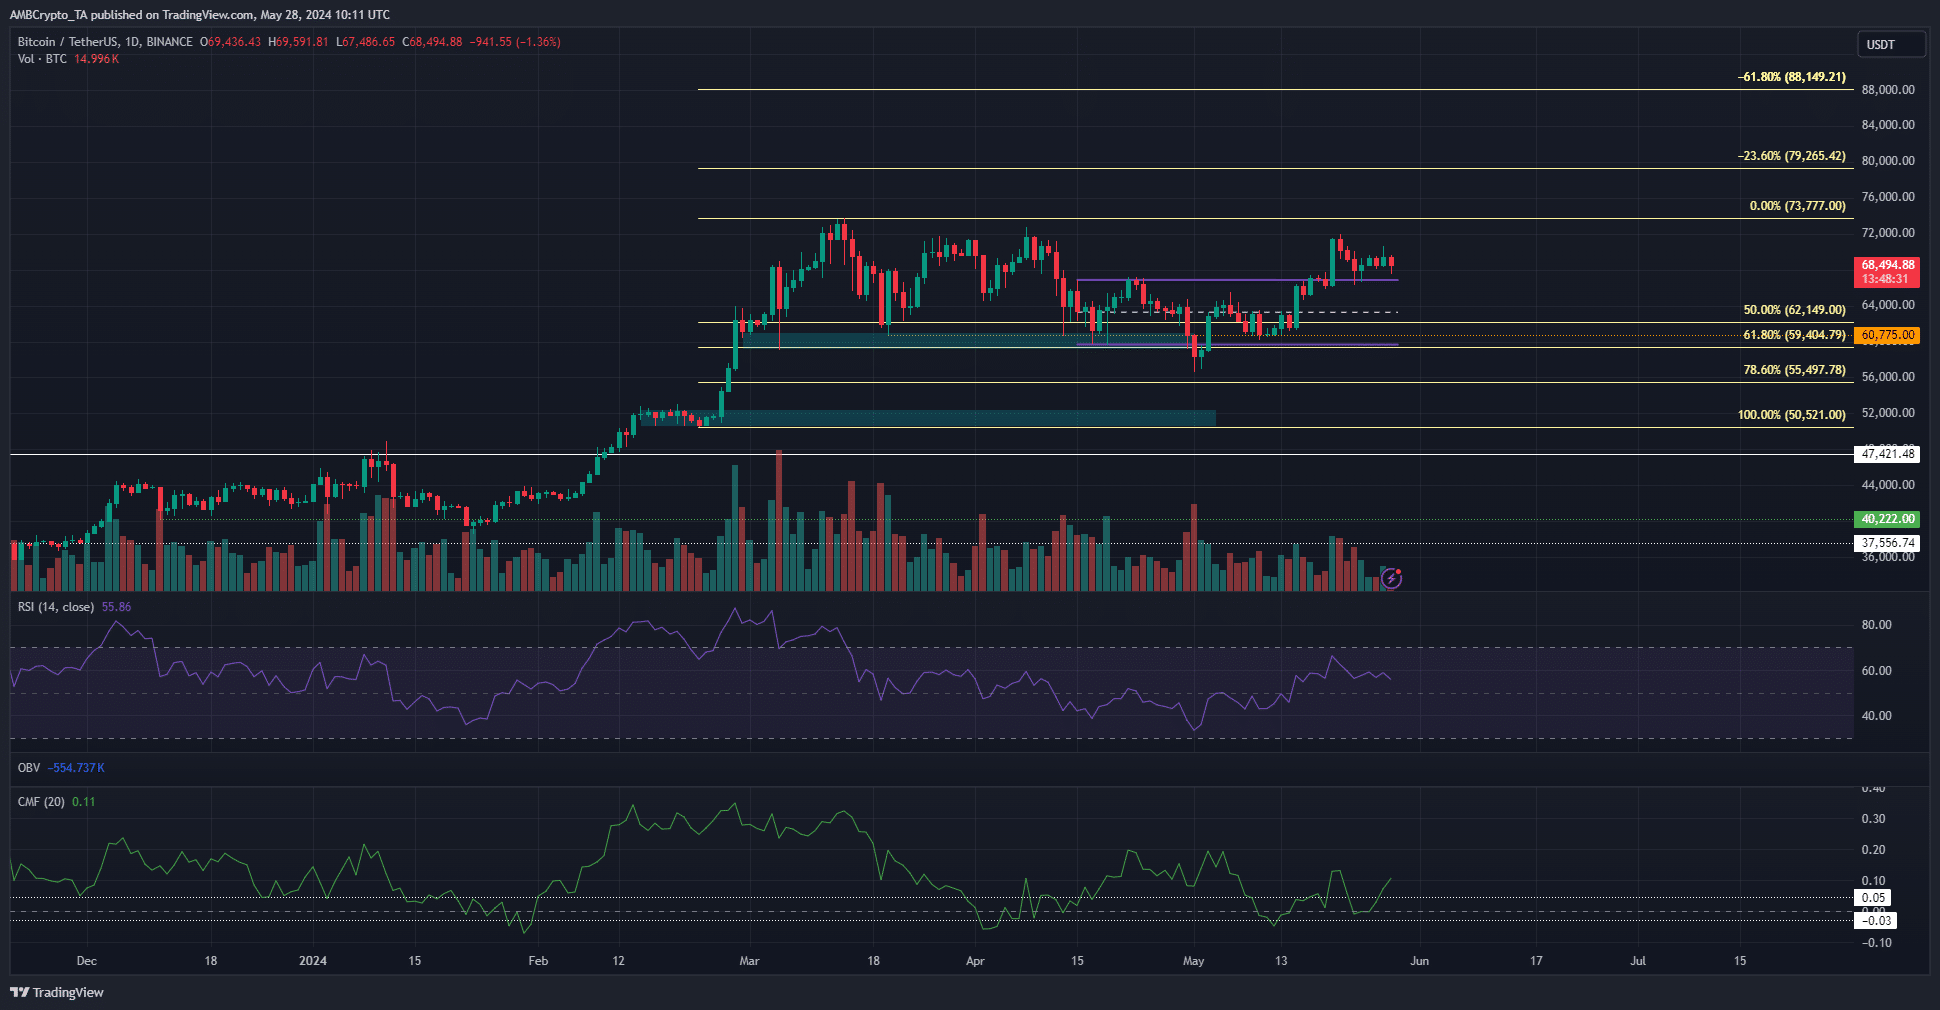
Source: BTC/USDT on TradingView
The price action on the 1-day chart was bullish. Bitcoin dropped below the 61.8% Fibonacci retracement level (pale yellow) at $59.4k in early May but was quick to recover.
It has flipped the short-term range (purple) high at $67k to support. Moreover, the CMF showed a reading of +0.12 to reflect significant capital inflow to the market.
The RSI on the daily chart was also above neutral 50 to signal bullish momentum. Together, the technical indicators pointed toward a bullish Bitcoin price prediction.
This indicated a lower timeframe liquidity hunt and outlined a consolidation phase. The higher timeframe uptrend will likely continue soon. The Fibonacci extension levels at $79.2k and $88.1k would be the target for buyers in the coming weeks.
Does the liquidation cluster to the south warrant Bitcoin’s attention?
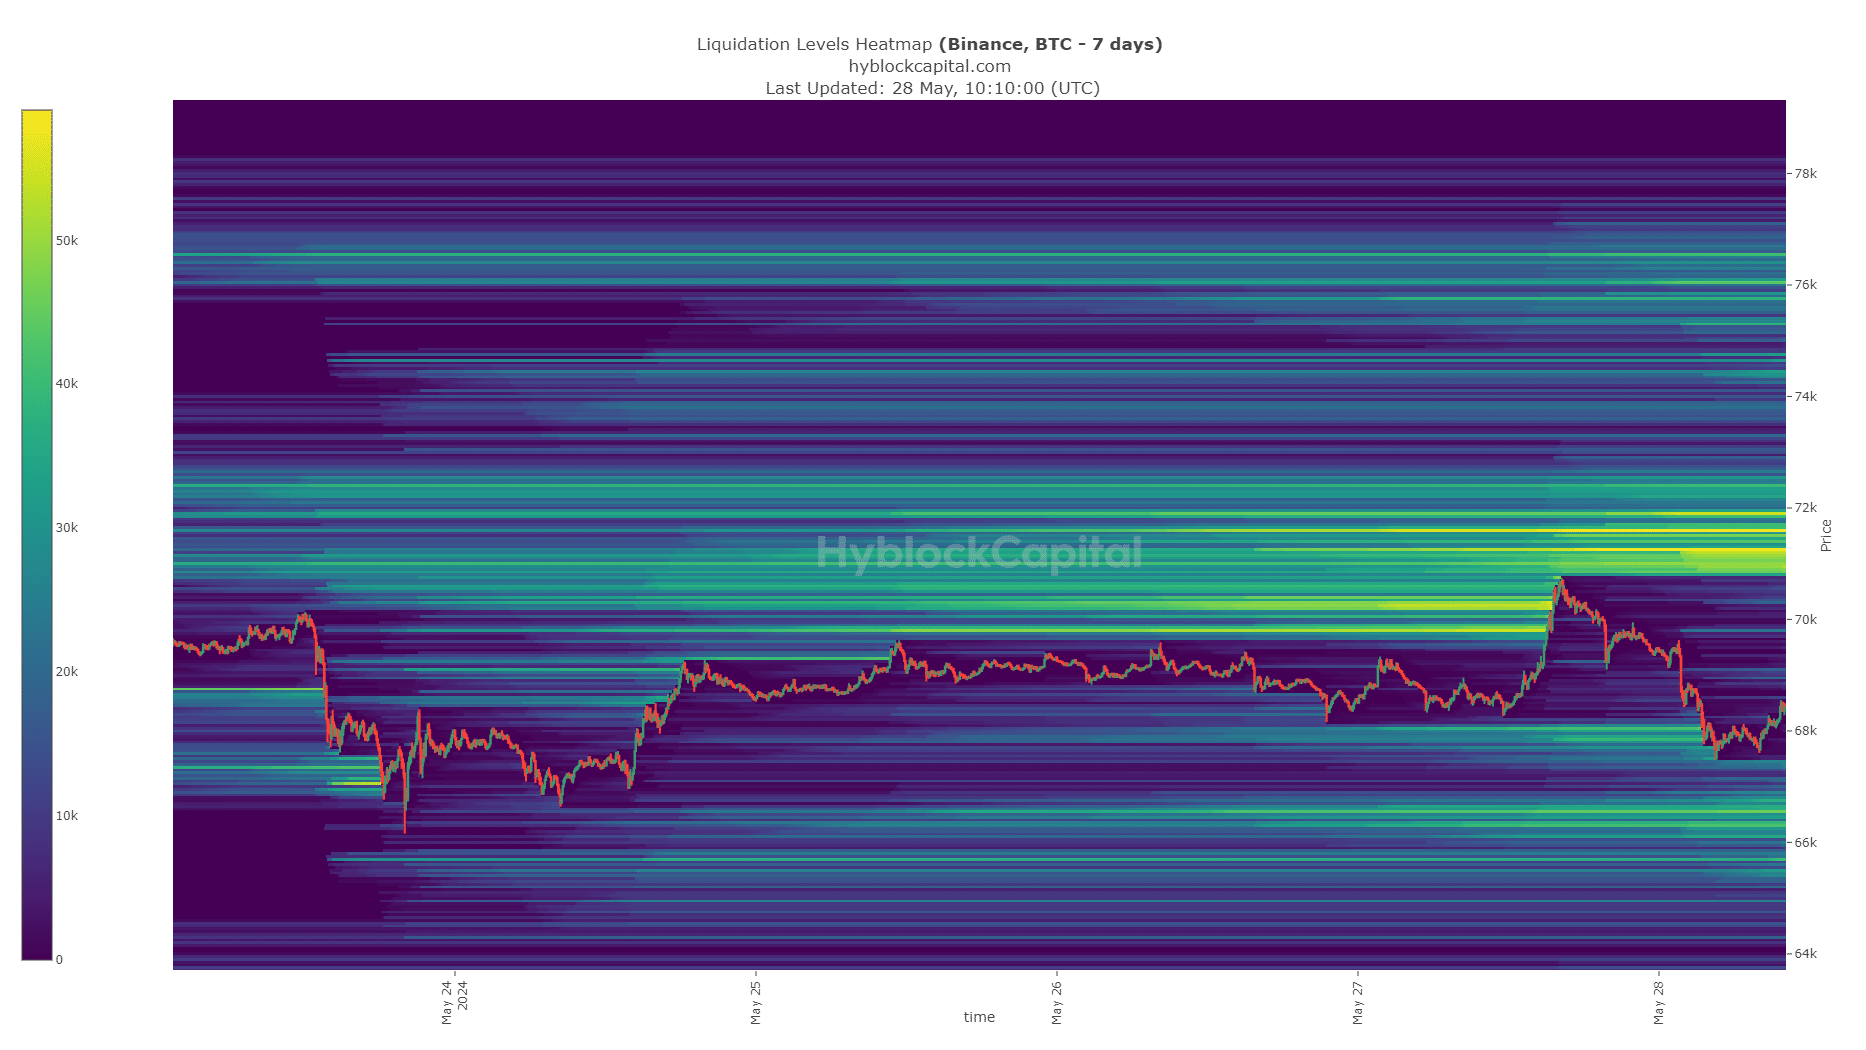
Source: Hyblock
The data from Hyblock showed that the $66.2k-$66.7k region was home to a cluster of liquidation levels, and BTC might dip to this region.
Read Bitcoin’s [BTC] Price Prediction 2024-25
Alternatively, the liquidity at $67.8k, which has already been swept, might be enough to propel Bitcoin back to the $71.2k resistance zone.
Traders need to be prepared for both outcomes and manage their risk accordingly. Short-term volatility was possible and a revisit of the $66.5k level would provide a buying opportunity.
Disclaimer: The information presented does not constitute financial, investment, trading, or other types of advice and is solely the writer’s opinion.
- Bitcoin has a bullish market structure on the daily timeframe.
- The significant capital inflow and strong momentum favored an upward move on the daily chart.
Bitcoin [BTC] saw increased demand from ETFs a month after the halving event. An AMBCrypto report noted that the altcoin performance has eclipsed Bitcoin recently.
Another AMBCrypto analysis drew parallels between the 2020 post-halving and current trends. The Rainbow Chart showed that BTC was still in the buy zone – does the Bitcoin price prediction agree?
Bitcoin bulls are not willing to force the issue yet
Source: BTC/USDT on TradingView
The price action on the 1-day chart was bullish. Bitcoin dropped below the 61.8% Fibonacci retracement level (pale yellow) at $59.4k in early May but was quick to recover.
It has flipped the short-term range (purple) high at $67k to support. Moreover, the CMF showed a reading of +0.12 to reflect significant capital inflow to the market.
The RSI on the daily chart was also above neutral 50 to signal bullish momentum. Together, the technical indicators pointed toward a bullish Bitcoin price prediction.
This indicated a lower timeframe liquidity hunt and outlined a consolidation phase. The higher timeframe uptrend will likely continue soon. The Fibonacci extension levels at $79.2k and $88.1k would be the target for buyers in the coming weeks.
Does the liquidation cluster to the south warrant Bitcoin’s attention?
Source: Hyblock
The data from Hyblock showed that the $66.2k-$66.7k region was home to a cluster of liquidation levels, and BTC might dip to this region.
Read Bitcoin’s [BTC] Price Prediction 2024-25
Alternatively, the liquidity at $67.8k, which has already been swept, might be enough to propel Bitcoin back to the $71.2k resistance zone.
Traders need to be prepared for both outcomes and manage their risk accordingly. Short-term volatility was possible and a revisit of the $66.5k level would provide a buying opportunity.
Disclaimer: The information presented does not constitute financial, investment, trading, or other types of advice and is solely the writer’s opinion.


where can i get generic clomiphene price how to get cheap clomid price clomiphene pill can i get clomiphene without rx generic clomiphene walmart can you buy generic clomid without insurance how to buy clomiphene pill
Thanks for putting this up. It’s understandably done.
With thanks. Loads of conception!
zithromax 500mg oral – tinidazole oral buy flagyl 200mg
semaglutide generic – cyproheptadine 4mg without prescription buy periactin 4mg generic
buy domperidone 10mg sale – buy tetracycline no prescription flexeril 15mg pill