


- Cardano has a strongly bearish market structure
- The technical indicators projected a deep price drop could arrive soon
Cardano [ADA] formed a bullish chart pattern that could see the token reach $1 in the coming weeks. Its social metrics have also improved as sentiment strengthened. However, the price action was not inspiring.
The price was below the January 2024 lows, and the technical indicators showed the bulls were weak. The Fibonacci levels projected how deep the next ADA drop could be.
Here’s what investors need to be prepared for.
The chances of a 30% plunge

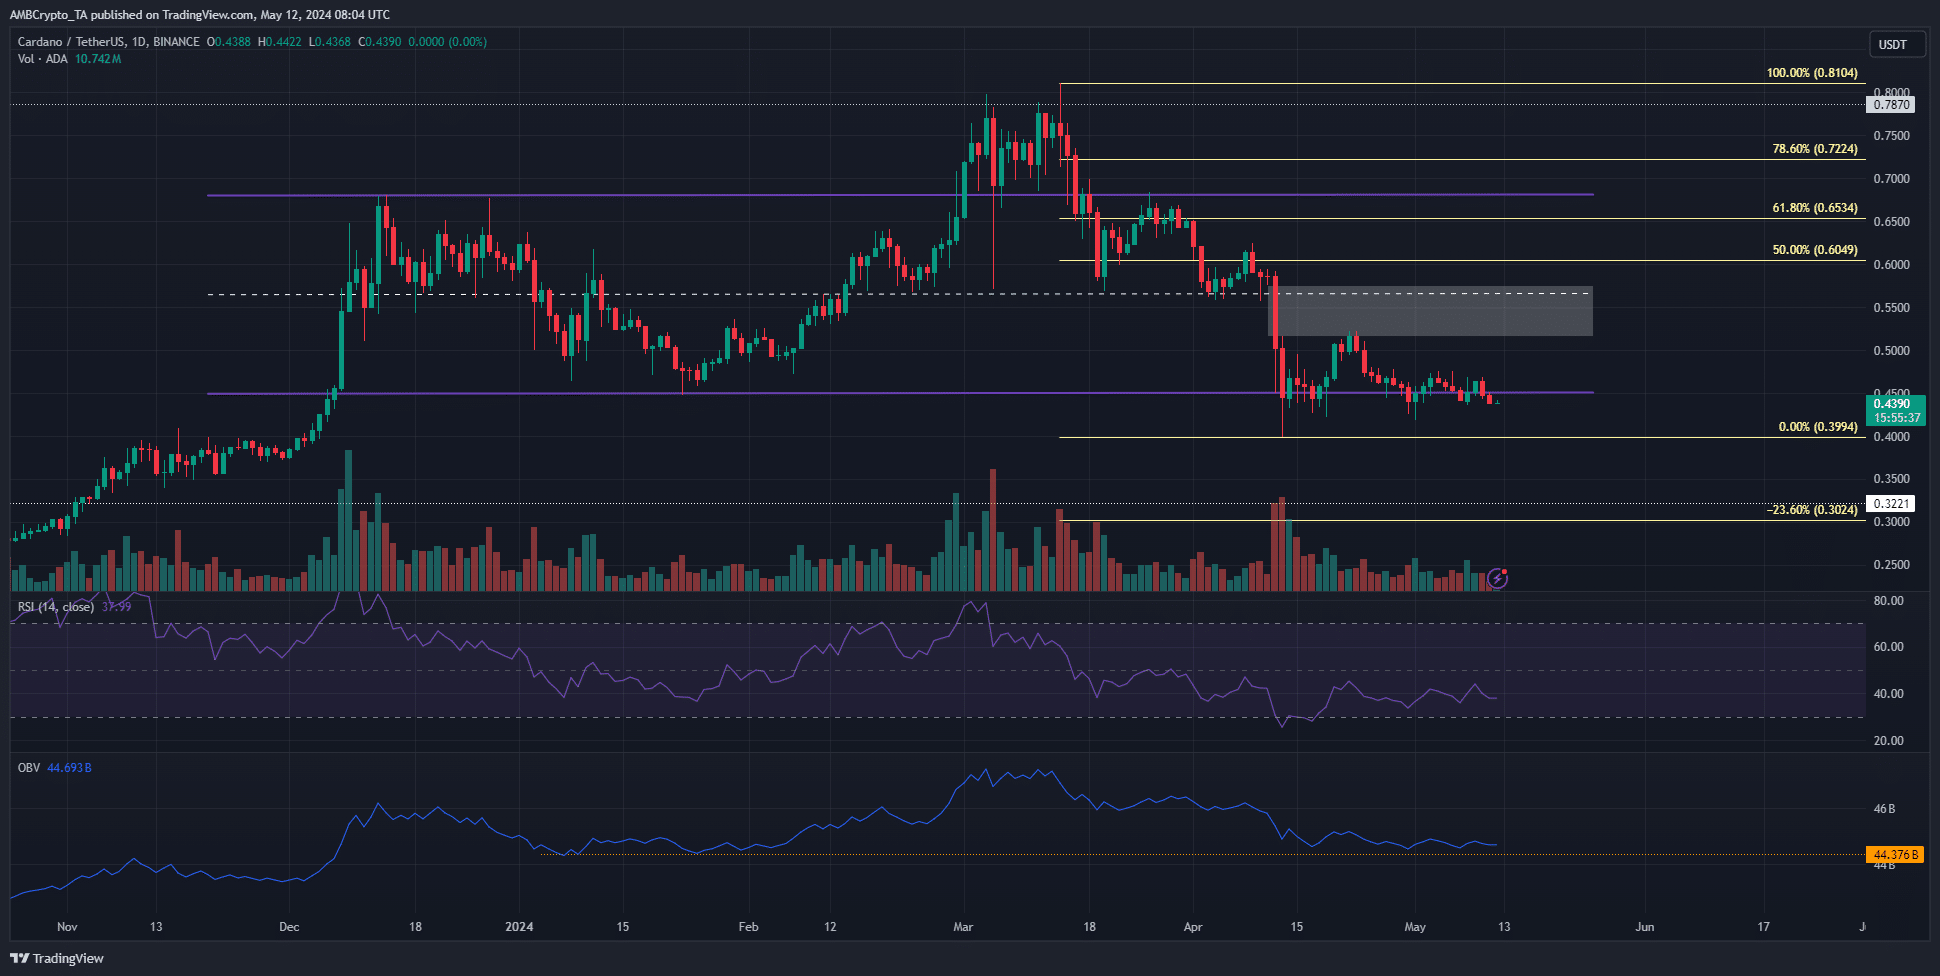
Source: ADA/USDT on TradingView
Throughout 2024, ADA has mostly traded within a range (purple) that reached from $0.447 to $0.678. In the past month, the prices have consistently hovered at or just below the range lows.
Additionally, in early April, the mid-range support level at $0.567 was breached and a sizeable imbalance (white) was left on the chart. This region was retested as resistance in mid-April.
Since then, the buying pressure has been insufficient for bulls to reclaim the $0.5 level.
This was reflected in the OBV which was back at a support level from earlier this year. Until buying volume and the OBV trends higher, more losses would be likely.
The RSI on the daily chart was also below neutral 50 to reflect downward momentum.
The Fibonacci levels (pale yellow) plotted based on the move down from $0.81 in March showed that the 23.6% southward extension at $0.3 was the next bearish target.
Short-selling was a popular route
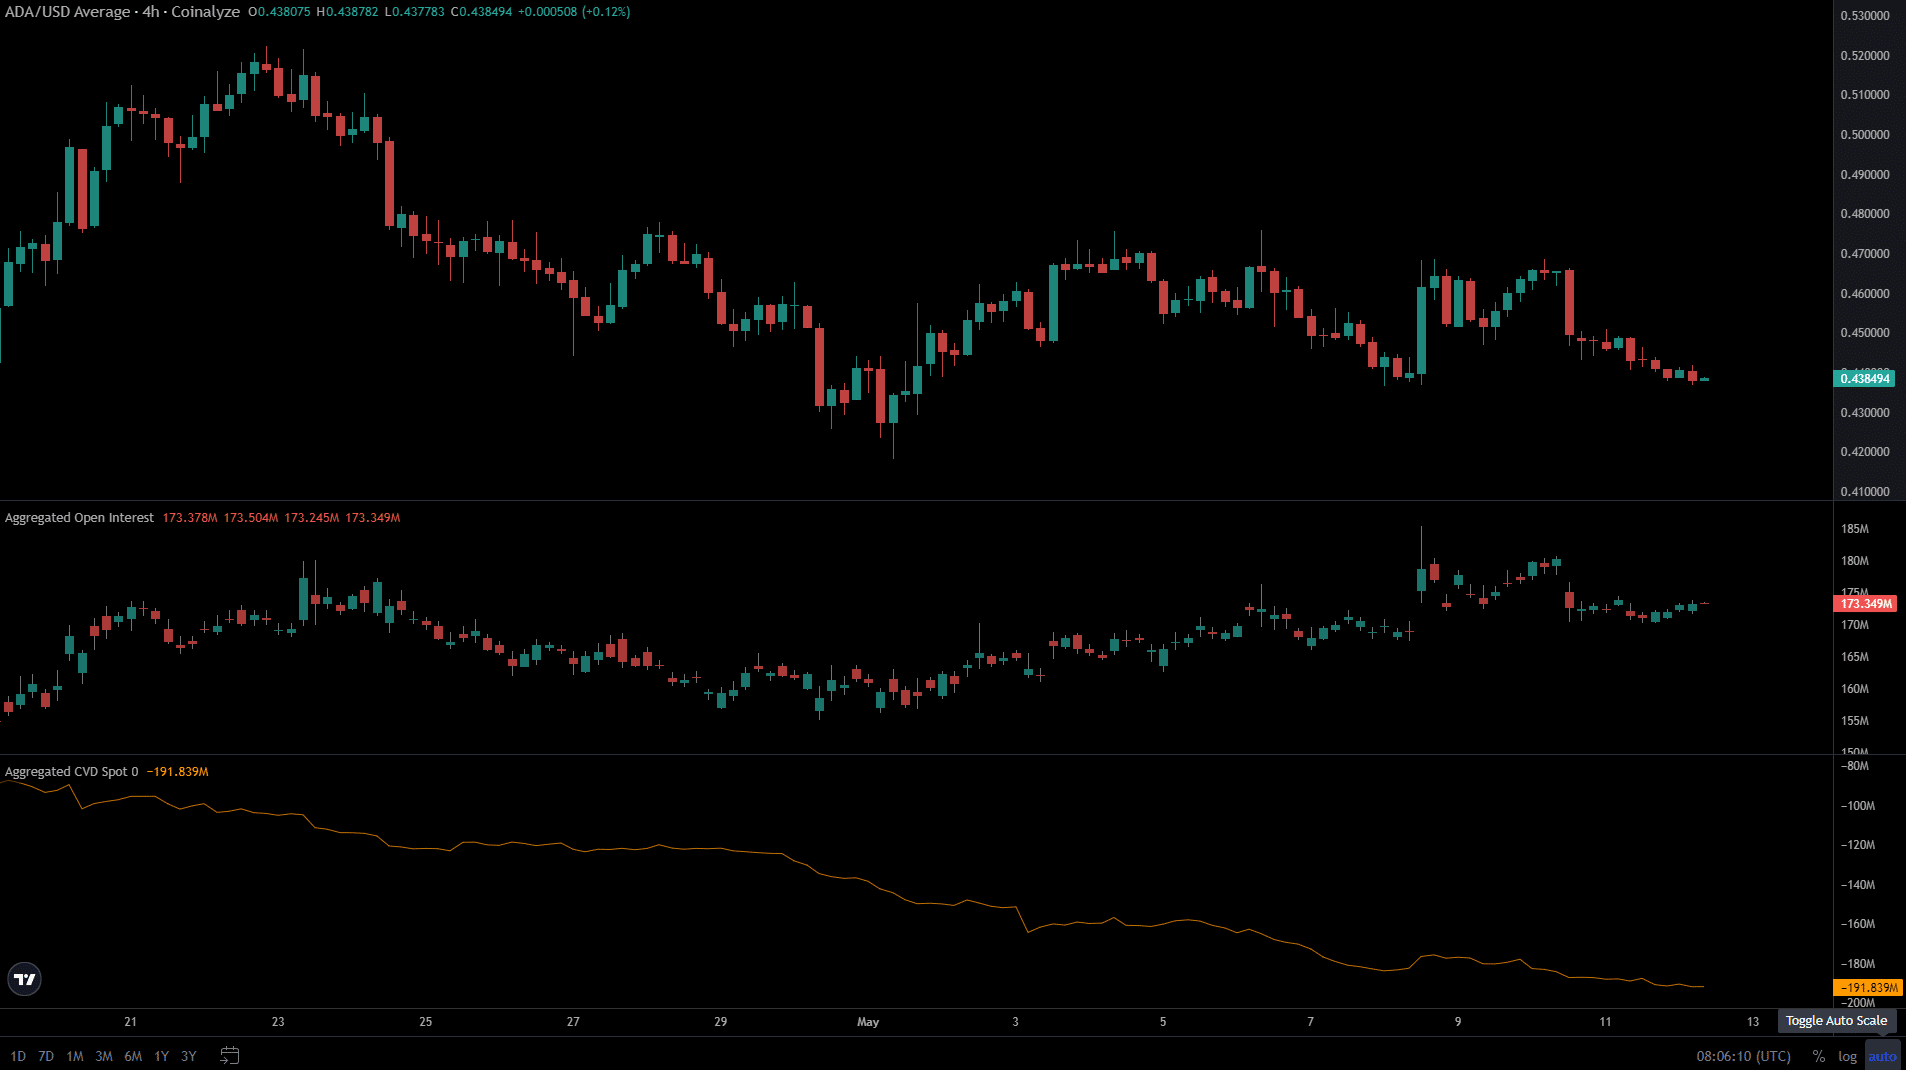
Source: Coinalyze
On the 11th and the 12th of May, the price of Cardano fell by 2% but the Open Interest rose slightly by $3 million. This showed that short-sellers were entering the market and outlined bearish sentiment.
The spot CVD also continued its downtrend, showing a lack of buying.
Read Cardano’s [ADA] Price Prediction 2024-25
The 30% drop projected by the Fibonacci levels could become a reality if the bulls do not step in and halt the consistent selling pressure.
They have not shown any signs of strength and were desperately fighting to defend the long-term range lows.
Disclaimer: The information presented does not constitute financial, investment, trading, or other types of advice and is solely the writer’s opinion.
- Cardano has a strongly bearish market structure
- The technical indicators projected a deep price drop could arrive soon
Cardano [ADA] formed a bullish chart pattern that could see the token reach $1 in the coming weeks. Its social metrics have also improved as sentiment strengthened. However, the price action was not inspiring.
The price was below the January 2024 lows, and the technical indicators showed the bulls were weak. The Fibonacci levels projected how deep the next ADA drop could be.
Here’s what investors need to be prepared for.
The chances of a 30% plunge
Source: ADA/USDT on TradingView
Throughout 2024, ADA has mostly traded within a range (purple) that reached from $0.447 to $0.678. In the past month, the prices have consistently hovered at or just below the range lows.
Additionally, in early April, the mid-range support level at $0.567 was breached and a sizeable imbalance (white) was left on the chart. This region was retested as resistance in mid-April.
Since then, the buying pressure has been insufficient for bulls to reclaim the $0.5 level.
This was reflected in the OBV which was back at a support level from earlier this year. Until buying volume and the OBV trends higher, more losses would be likely.
The RSI on the daily chart was also below neutral 50 to reflect downward momentum.
The Fibonacci levels (pale yellow) plotted based on the move down from $0.81 in March showed that the 23.6% southward extension at $0.3 was the next bearish target.
Short-selling was a popular route
Source: Coinalyze
On the 11th and the 12th of May, the price of Cardano fell by 2% but the Open Interest rose slightly by $3 million. This showed that short-sellers were entering the market and outlined bearish sentiment.
The spot CVD also continued its downtrend, showing a lack of buying.
Read Cardano’s [ADA] Price Prediction 2024-25
The 30% drop projected by the Fibonacci levels could become a reality if the bulls do not step in and halt the consistent selling pressure.
They have not shown any signs of strength and were desperately fighting to defend the long-term range lows.
Disclaimer: The information presented does not constitute financial, investment, trading, or other types of advice and is solely the writer’s opinion.


You actually make it appear really easy together with your presentation however I to find this matter to be really one thing which I think I might never understand. It sort of feels too complicated and very huge for me. I am taking a look ahead on your subsequent submit, I will attempt to get the hold of it!
I’m impressed, I need to say. Actually hardly ever do I encounter a weblog that’s each educative and entertaining, and let me inform you, you could have hit the nail on the head. Your idea is excellent; the problem is something that not enough individuals are talking intelligently about. I am very blissful that I stumbled across this in my seek for something relating to this.
Pretty! This was a really wonderful post. Thank you for your provided information.
Can I simply say what a reduction to seek out someone who actually is aware of what theyre speaking about on the internet. You definitely know the right way to deliver a problem to gentle and make it important. More folks have to read this and perceive this aspect of the story. I cant imagine youre not more in style because you definitely have the gift.
clomid price at clicks buy generic clomiphene without dr prescription clomid one fallopian tube buying generic clomiphene price cost of clomid without a prescription can you buy cheap clomid pills where can i buy clomid pill
Thanks an eye to sharing. It’s first quality.
More posts like this would make the blogosphere more useful.
order azithromycin online cheap – purchase tindamax online order metronidazole 200mg
buy semaglutide 14mg online – cyproheptadine 4 mg pill oral periactin
buy domperidone sale – buy tetracycline generic order flexeril
how to buy propranolol – inderal online cheap methotrexate 5mg
order amoxil pill – where to buy diovan without a prescription buy combivent online
azithromycin 250mg sale – buy tinidazole without prescription order bystolic 20mg without prescription
amoxiclav ca – at bio info ampicillin order online
nexium capsules – https://anexamate.com/ buy nexium no prescription
medex for sale online – https://coumamide.com/ buy cozaar
mobic without prescription – https://moboxsin.com/ buy meloxicam without prescription
buy deltasone 5mg online cheap – https://apreplson.com/ prednisone 5mg without prescription
I got what you mean , regards for putting up.Woh I am lucky to find this website through google. “Food is the most primitive form of comfort.” by Sheila Graham.
hims ed pills – fastedtotake where to buy ed pills online
order amoxil – order amoxil online how to buy amoxil
diflucan where to buy – how to get forcan without a prescription brand diflucan
what is the difference between cialis and tadalafil? – https://ciltadgn.com/# generic cialis tadalafil 20mg india
zantac for sale online – https://aranitidine.com/ ranitidine generic
cialis over the counter at walmart – https://strongtadafl.com/# pregnancy category for tadalafil
Thanks on putting this up. It’s evidently done. this
buy female viagra – site cheap viagra inurl /profile/
More articles like this would make the blogosphere richer. https://ursxdol.com/clomid-for-sale-50-mg/
More content pieces like this would urge the интернет better. https://buyfastonl.com/azithromycin.html
This is the kind of scribble literary works I truly appreciate. https://prohnrg.com/product/cytotec-online/
Enjoyed looking at this, very good stuff, thanks.
Thanks recompense sharing. It’s outstrip quality. https://aranitidine.com/fr/sibelium/
I’ll certainly bring back to read more. https://ondactone.com/simvastatin/
This is the description of serenity I enjoy reading.
https://doxycyclinege.com/pro/warfarin/
I think that is one of the such a lot significant info for me. And i am satisfied reading your article. However want to statement on few normal things, The site style is wonderful, the articles is in reality nice : D. Just right activity, cheers
I couldn’t turn down commenting. Warmly written! https://experthax.com/forum/member.php?action=profile&uid=124578
Awesome blog! Is your theme custom made or did you download it from somewhere? A theme like yours with a few simple adjustements would really make my blog jump out. Please let me know where you got your design. Many thanks
Perfectly pent content material, Really enjoyed reading.
order forxiga 10 mg online – site buy forxiga pills
Right now it appears like Drupal is the preferred blogging platform available right now. (from what I’ve read) Is that what you are using on your blog?
xenical online order – https://asacostat.com/# cheap xenical 60mg
More content pieces like this would make the интернет better. http://www.predictive-datascience.com/forum/member.php?action=profile&uid=46024