


- DOT’s price dropped by 20% in the last 30 days.
- A few technical indicators looked bullish on the token.
Polkadot [DOT] bears have been controlling the token’s price for a few days as its value moved sideways. However, this might just be the tip of the iceberg, as the larger picture looked different.
If the latest data is to be considered, the possibility of DOT initiating a bull rally is high.
Polkadot is getting ready for a pump
According to CoinMarketCap, DOT’s price only moved marginally in the last seven days. But things got worse in the last 24 hours as the token’s value dropped by over 1.8%.
At the time of writing, DOT was trading at $8.42 with a market capitalization of over $12 billion. However, investors must not get disheartened, as a bull pattern appeared on the token’s price chart.
As per a tweet from FLASH, a popular crypto analyst, Polkadot’s price was about to break out of a bull pattern that earlier had resulted in bull rallies.
To be precise, DOT’s price gained bullish momentum back in February and November 2023 after it broke above a similar pattern. If history repeats itself, then investors might soon witness DOT’s price touch its March highs once again.
Apart from this, DOT also reached a milestone in terms of its network activity. AMBCrypto reported a few days ago that DOT’s total number of active accounts in the ecosystem surpassed 605,000, reflecting high network usage and adoption.
Is a bull rally inevitable?
To check the possibility of DOT actually bearing above the pattern, AMBCrypto took a look at its on-chain metrics. Our analysis of Santiment’s data revealed that DOT’s open interest remained relatively high.
Whenever the metric rises, it indicates that the on-going price trend might continue, which in this instance was bearish.
The token’s funding rate also looked bearish. Generally, the price tends to move the other way than the funding rate. Since DOT’s funding rate was high, the chances of DOT’s value declining further seem high.
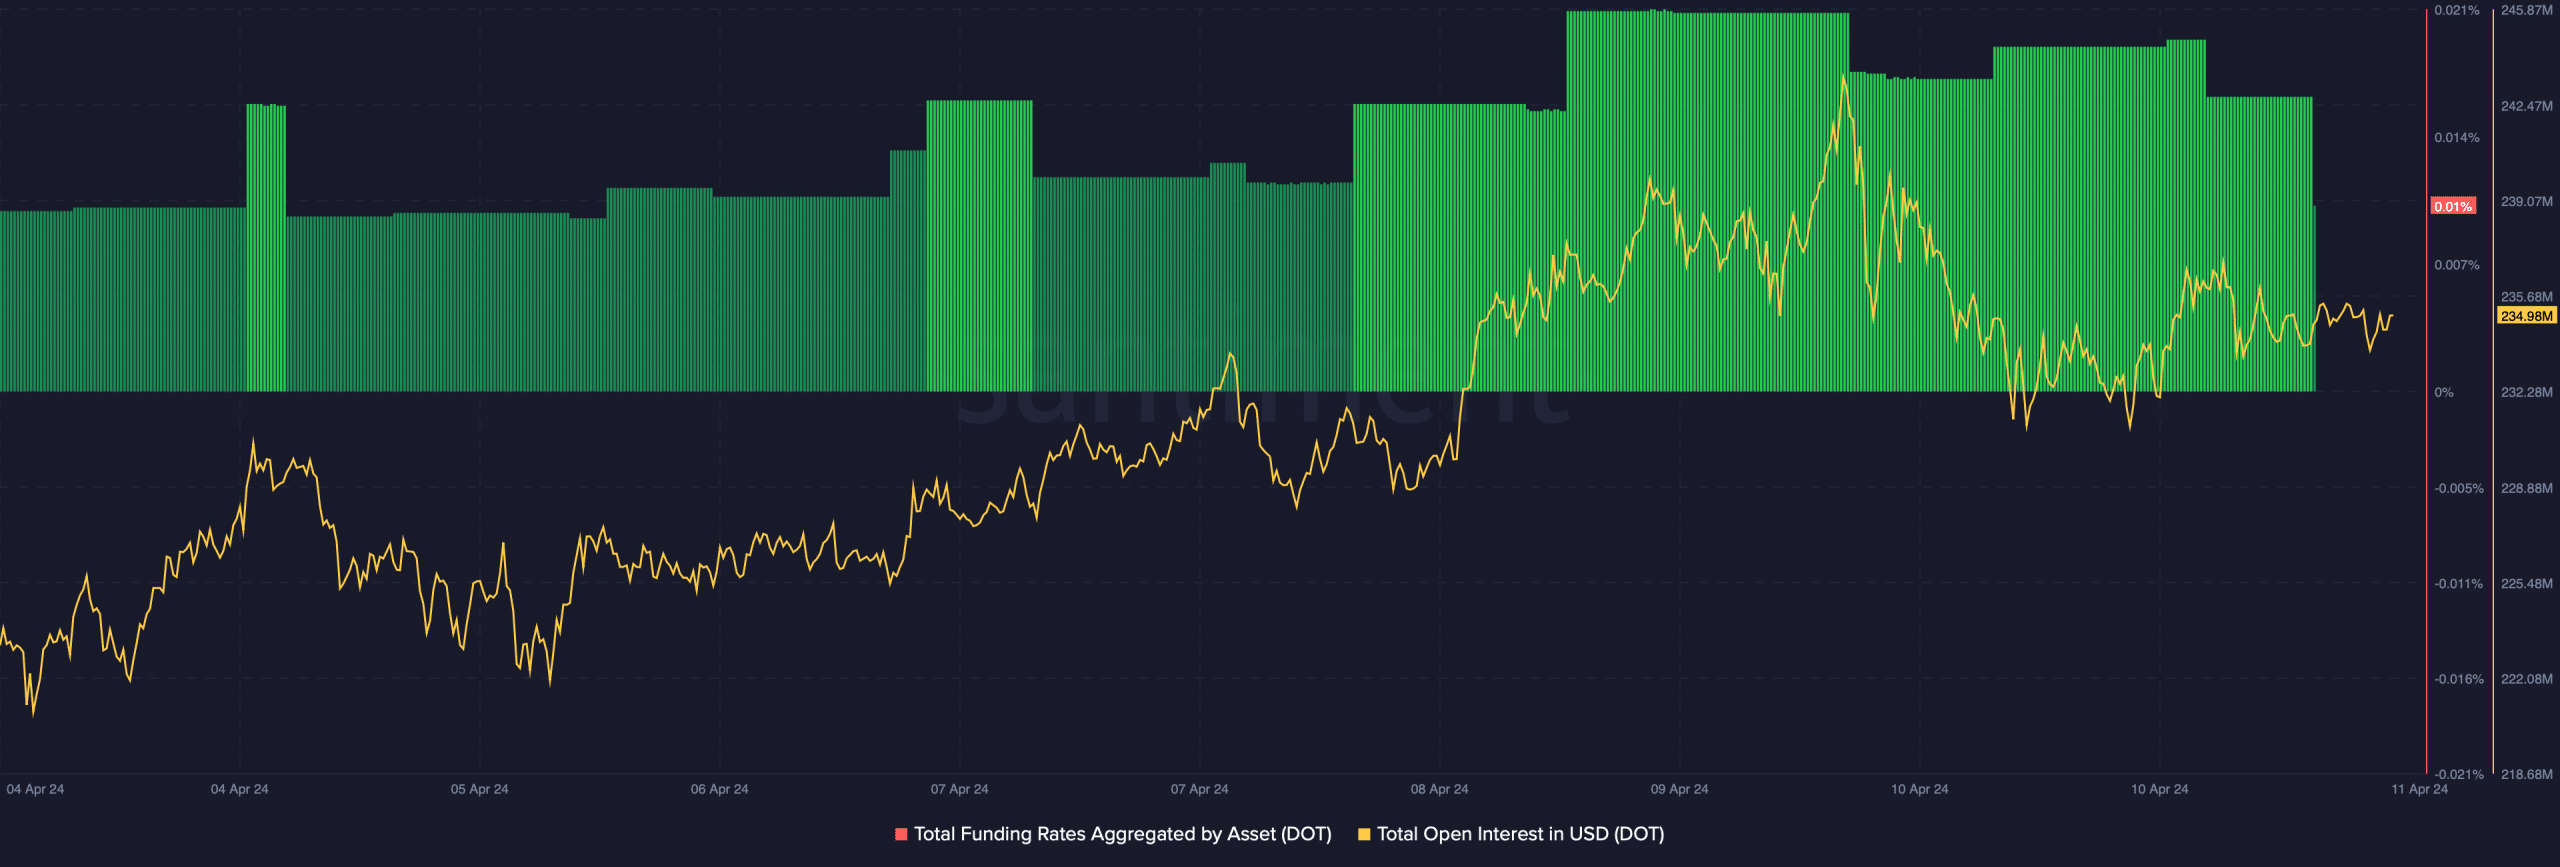
Source: Santiment
Realistic or not, here’s DOT market cap in BTC’s terms
We then planned to check Polkadot’s daily chart to better understand the chances of DOT’s price gaining bullish momentum. As per the analysis, DOT’s Relative Strength Index (RSI) was bearish as it was resting below the neutral mark.
However, the Chaikin Money Flow (CMF) and Money Flow Index (MFI) supported the possibility of DOT breaking above the bullish pattern. This was the case as both of these technical indicators registered upticks in the last few days.
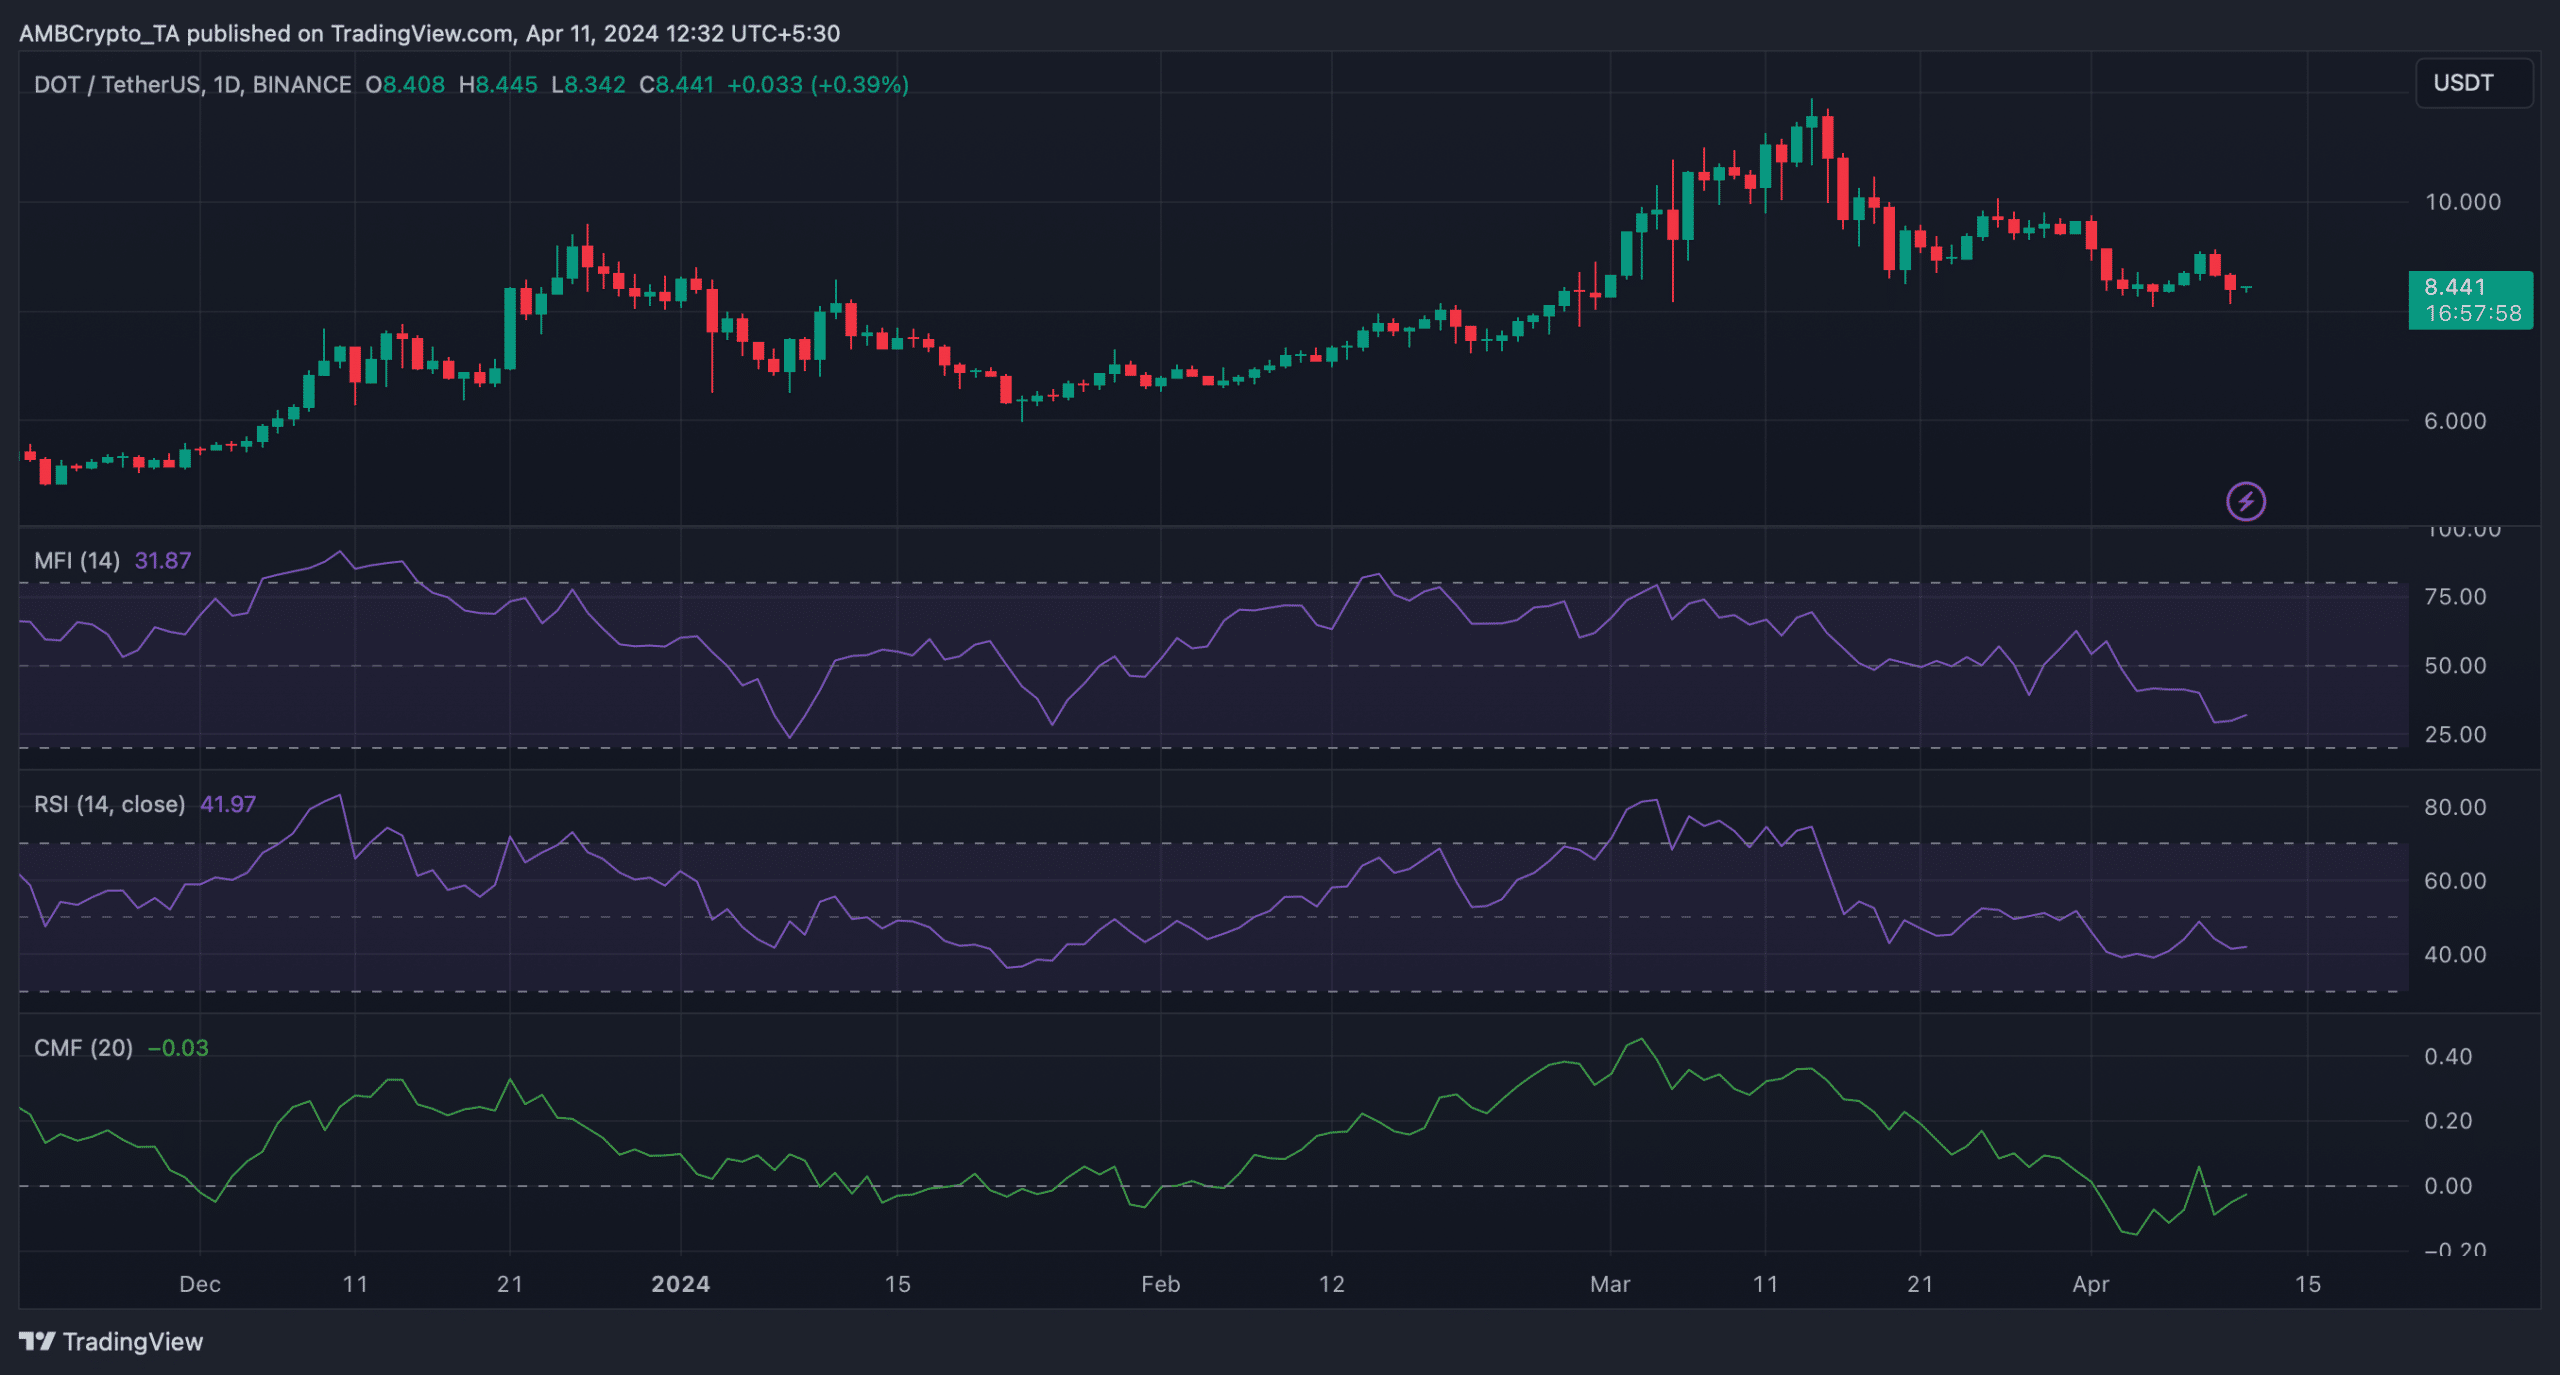
Source: TradingView


I like this site so much, saved to fav. “I don’t care what is written about me so long as it isn’t true.” by Dorothy Parker.
Great beat ! I would like to apprentice while you amend your website, how could i subscribe for a blog site? The account aided me a acceptable deal. I had been tiny bit acquainted of this your broadcast provided bright clear concept
Appreciate it for helping out, great info .
I have read several excellent stuff here. Certainly price bookmarking for revisiting. I surprise how much effort you put to make any such excellent informative web site.
I really appreciate this post. I’ve been looking everywhere for this! Thank goodness I found it on Bing. You’ve made my day! Thx again!
Hi there! I know this is kinda off topic however , I’d figured I’d ask. Would you be interested in exchanging links or maybe guest authoring a blog article or vice-versa? My blog discusses a lot of the same topics as yours and I think we could greatly benefit from each other. If you might be interested feel free to shoot me an email. I look forward to hearing from you! Wonderful blog by the way!
You made some good points there. I looked on the internet for the topic and found most people will go along with with your blog.
I think this is one of the most vital information for me. And i’m glad reading your article. But wanna remark on few general things, The site style is perfect, the articles is really great : D. Good job, cheers
There are certainly a whole lot of details like that to take into consideration. That could be a nice level to bring up. I supply the ideas above as normal inspiration however clearly there are questions just like the one you deliver up the place an important factor can be working in trustworthy good faith. I don?t know if finest practices have emerged round issues like that, but I am positive that your job is clearly identified as a fair game. Both girls and boys feel the affect of just a moment’s pleasure, for the rest of their lives.
You made various fine points there. I did a search on the subject matter and found nearly all persons will agree with your blog.