


![What Is Asset Tokenization? Types, Why It Matters Now [2025]](https://coininsights.com/wp-content/uploads/2025/05/asset_tokenization-360x180.png)


- Data from the futures market showed strong bullish sentiment.
- Order book data highlighted key resistance and support levels.
Ethereum [ETH] had lagged behind Bitcoin [BTC] in the first two weeks of February. At that time ETH struggled to beat the $2.5k and $2.6k resistance levels while BTC soared past the $48k and $50k resistances.
Ethereum has caught up in terms of performance, and this was accompanied by a wild spike in speculative activity. Bulls were eager to score quick profits when they saw the strength of the momentum behind ETH.
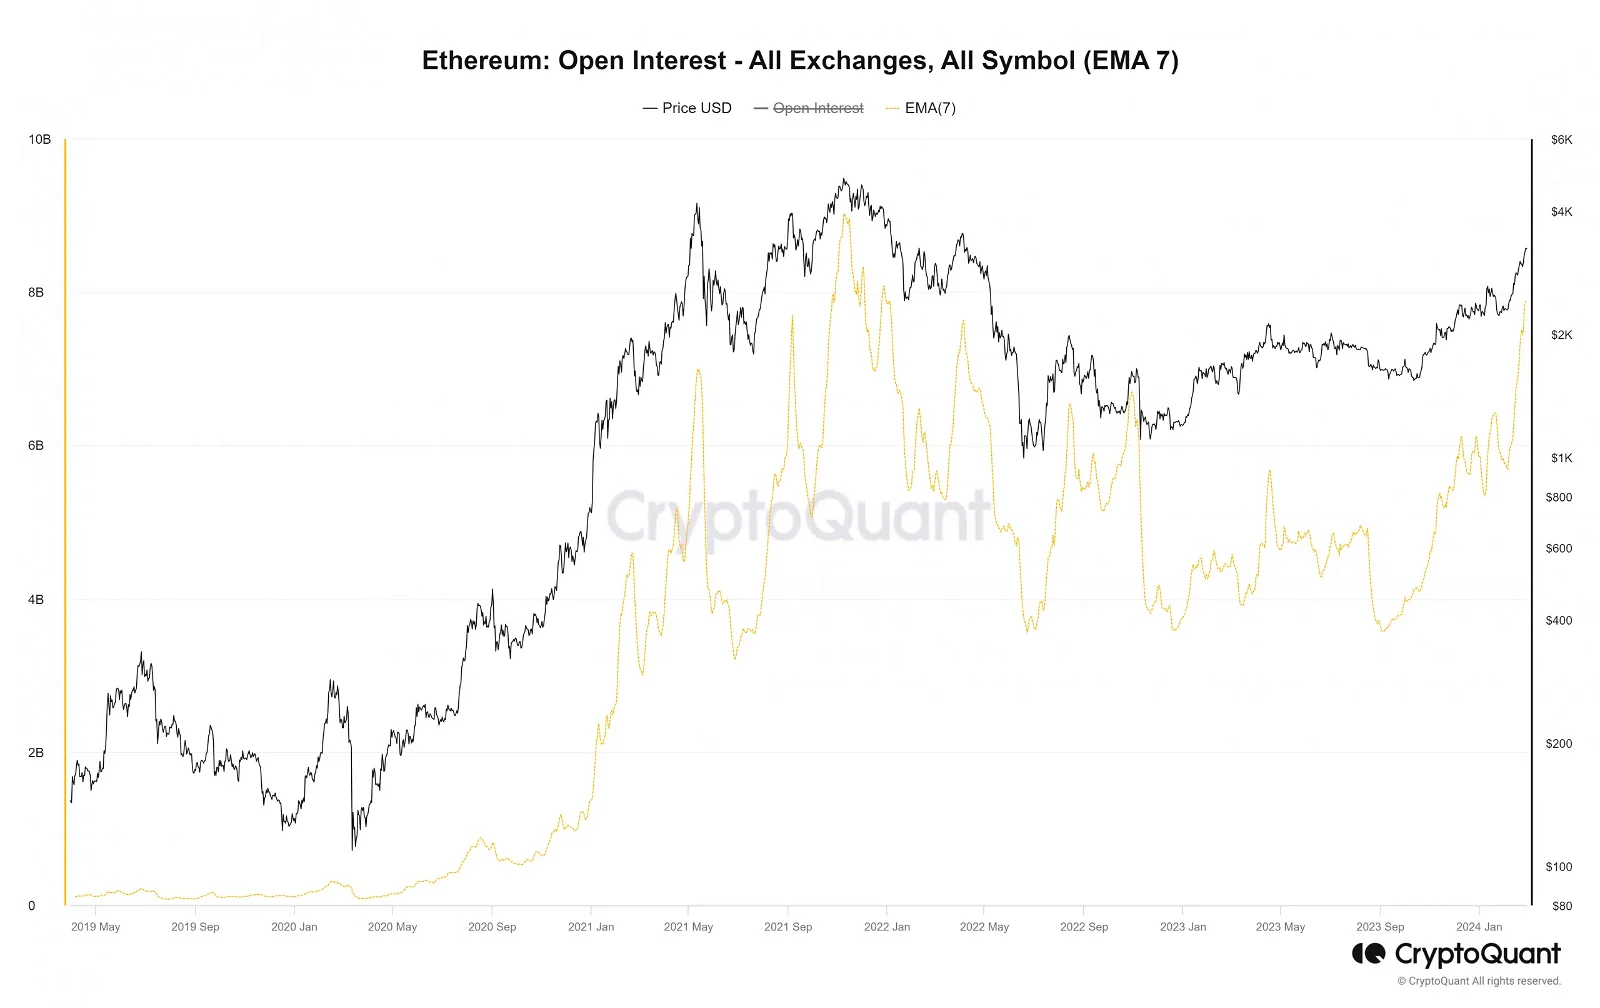
The Open Interest reaches a nearly two-year high
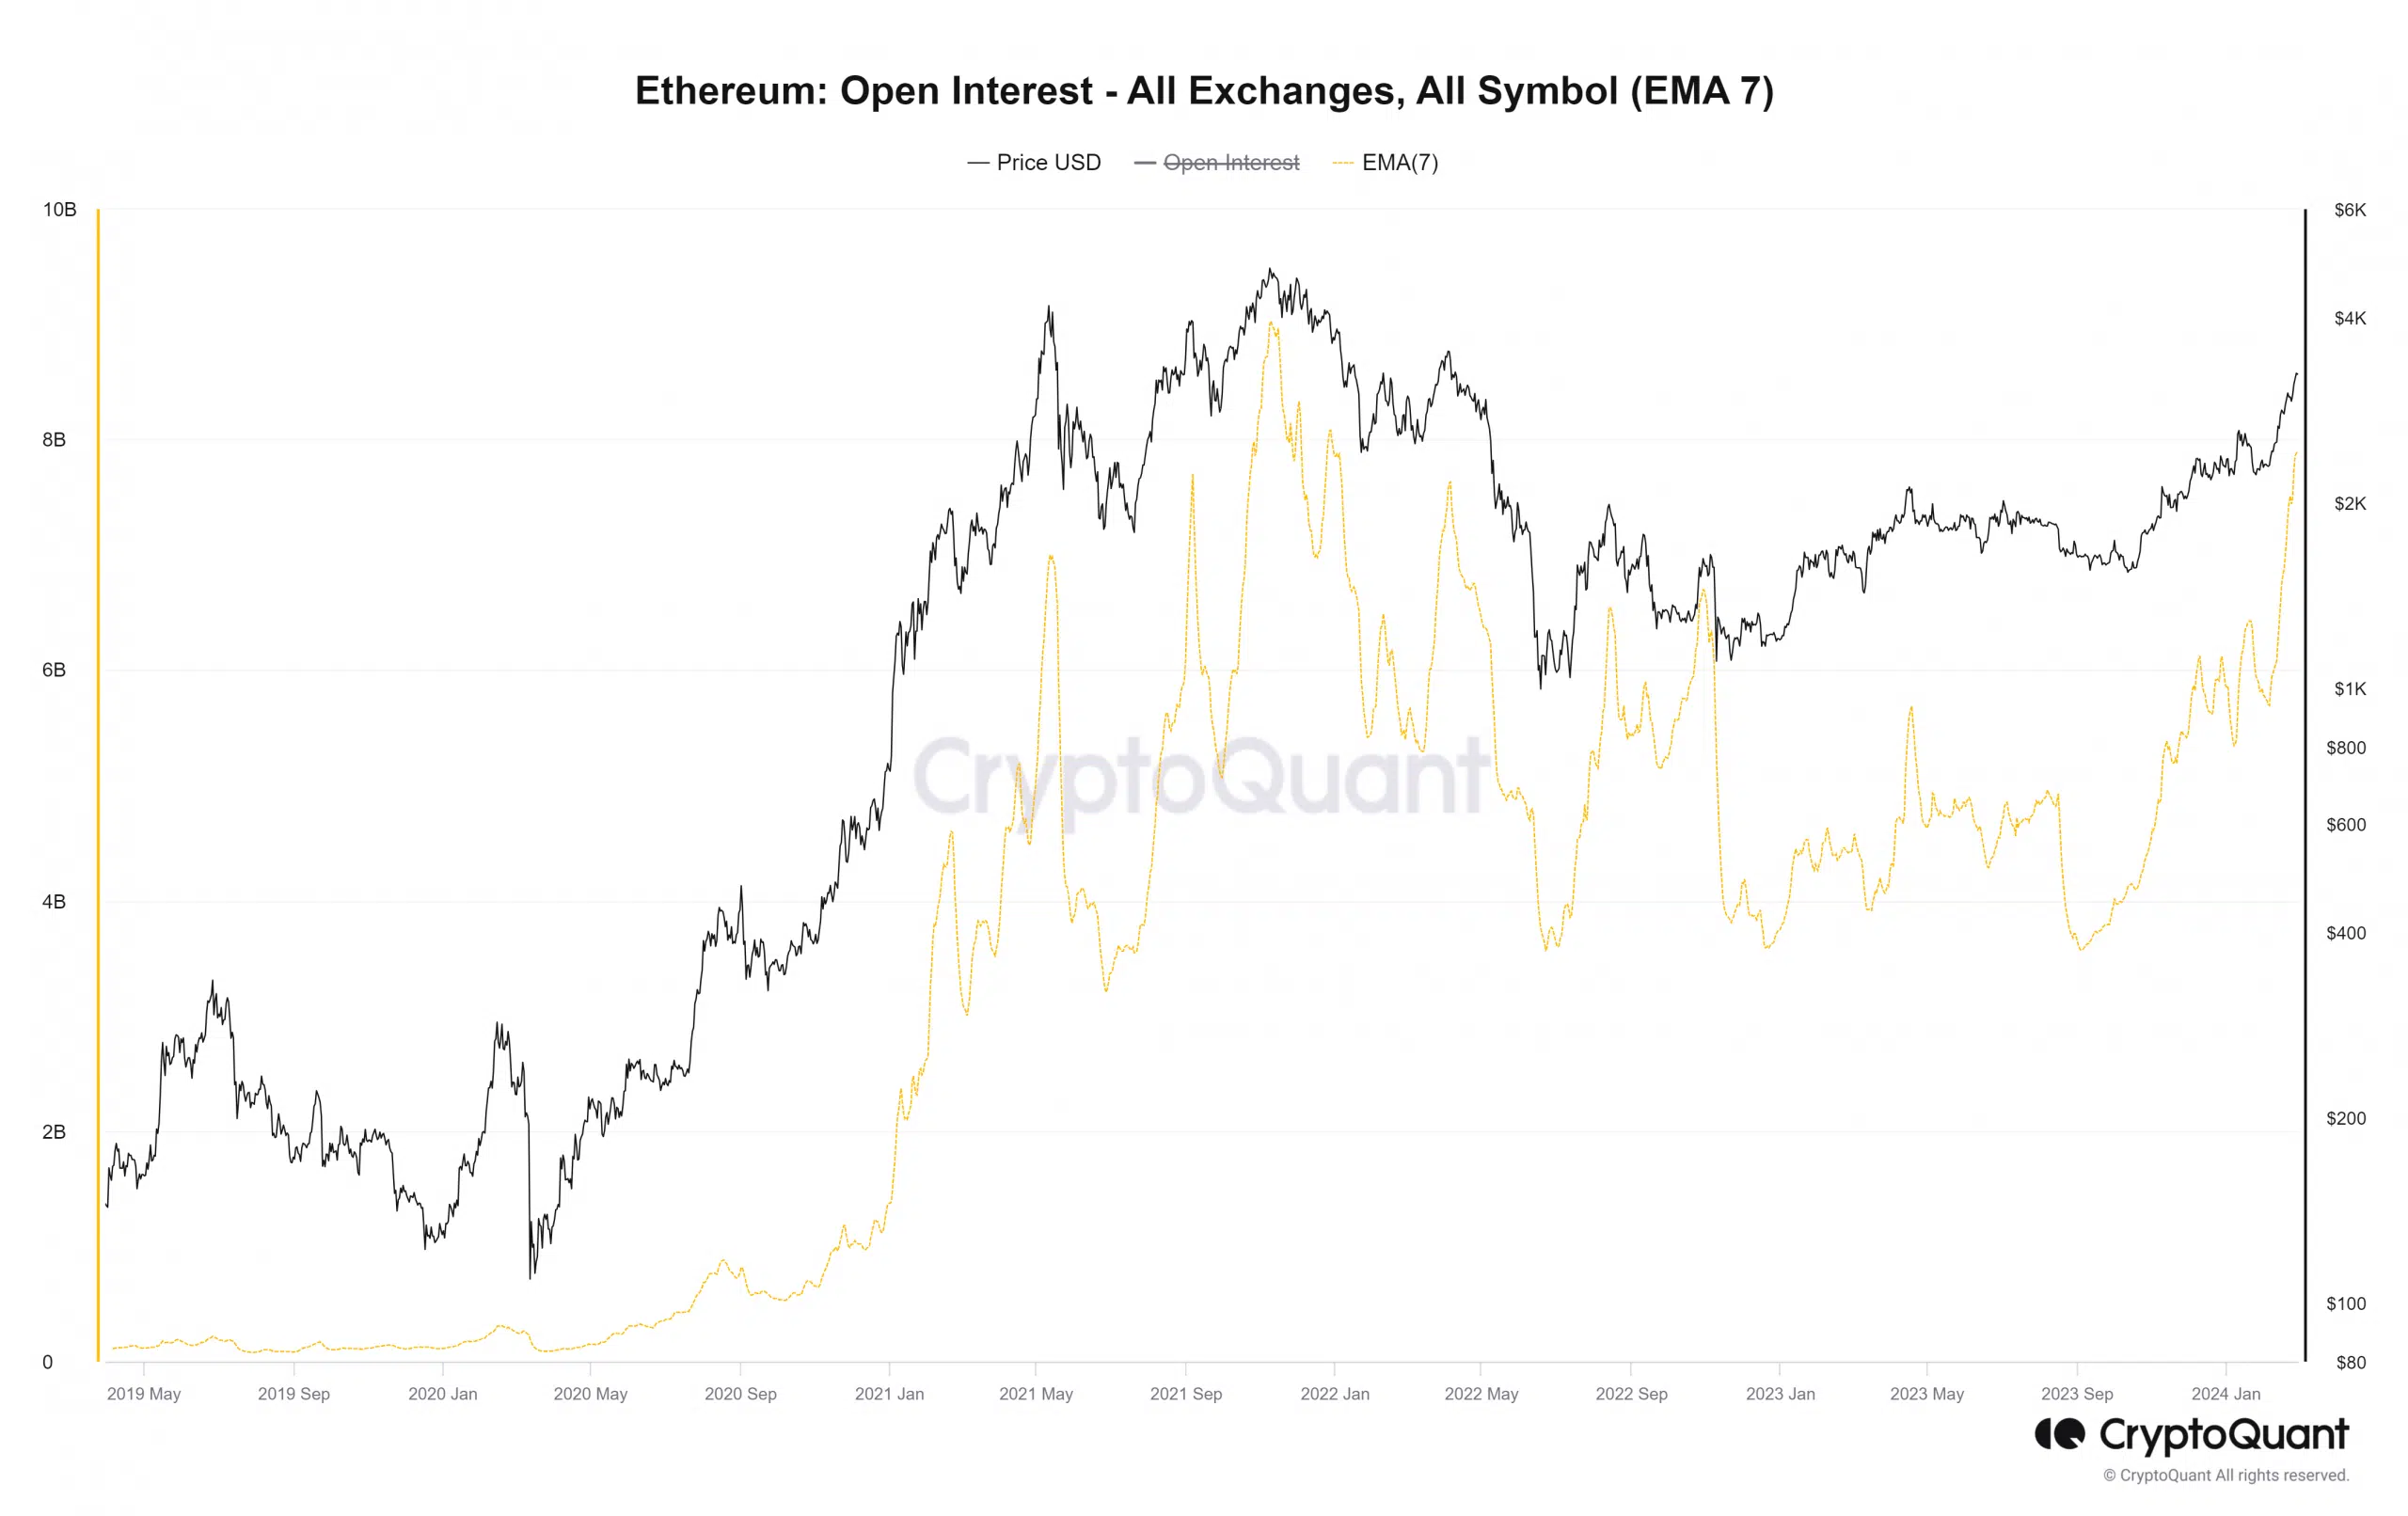
Source: CryptoQuant
On April 5th, 2022, the OI of ETH reached the $7.6 billion level but plummeted swiftly in the next two months as Ethereum prices crashed from $3.4k to $1.2k. At the time of writing, the OI stood at $7.8 billion as prices reclaimed the psychological $3k level.
This was a clear sign that sentiment was firmly in favor of the buyers. Such rapid growth also leaves room for lower timeframe price volatility, so traders using high leverage must be extremely careful.
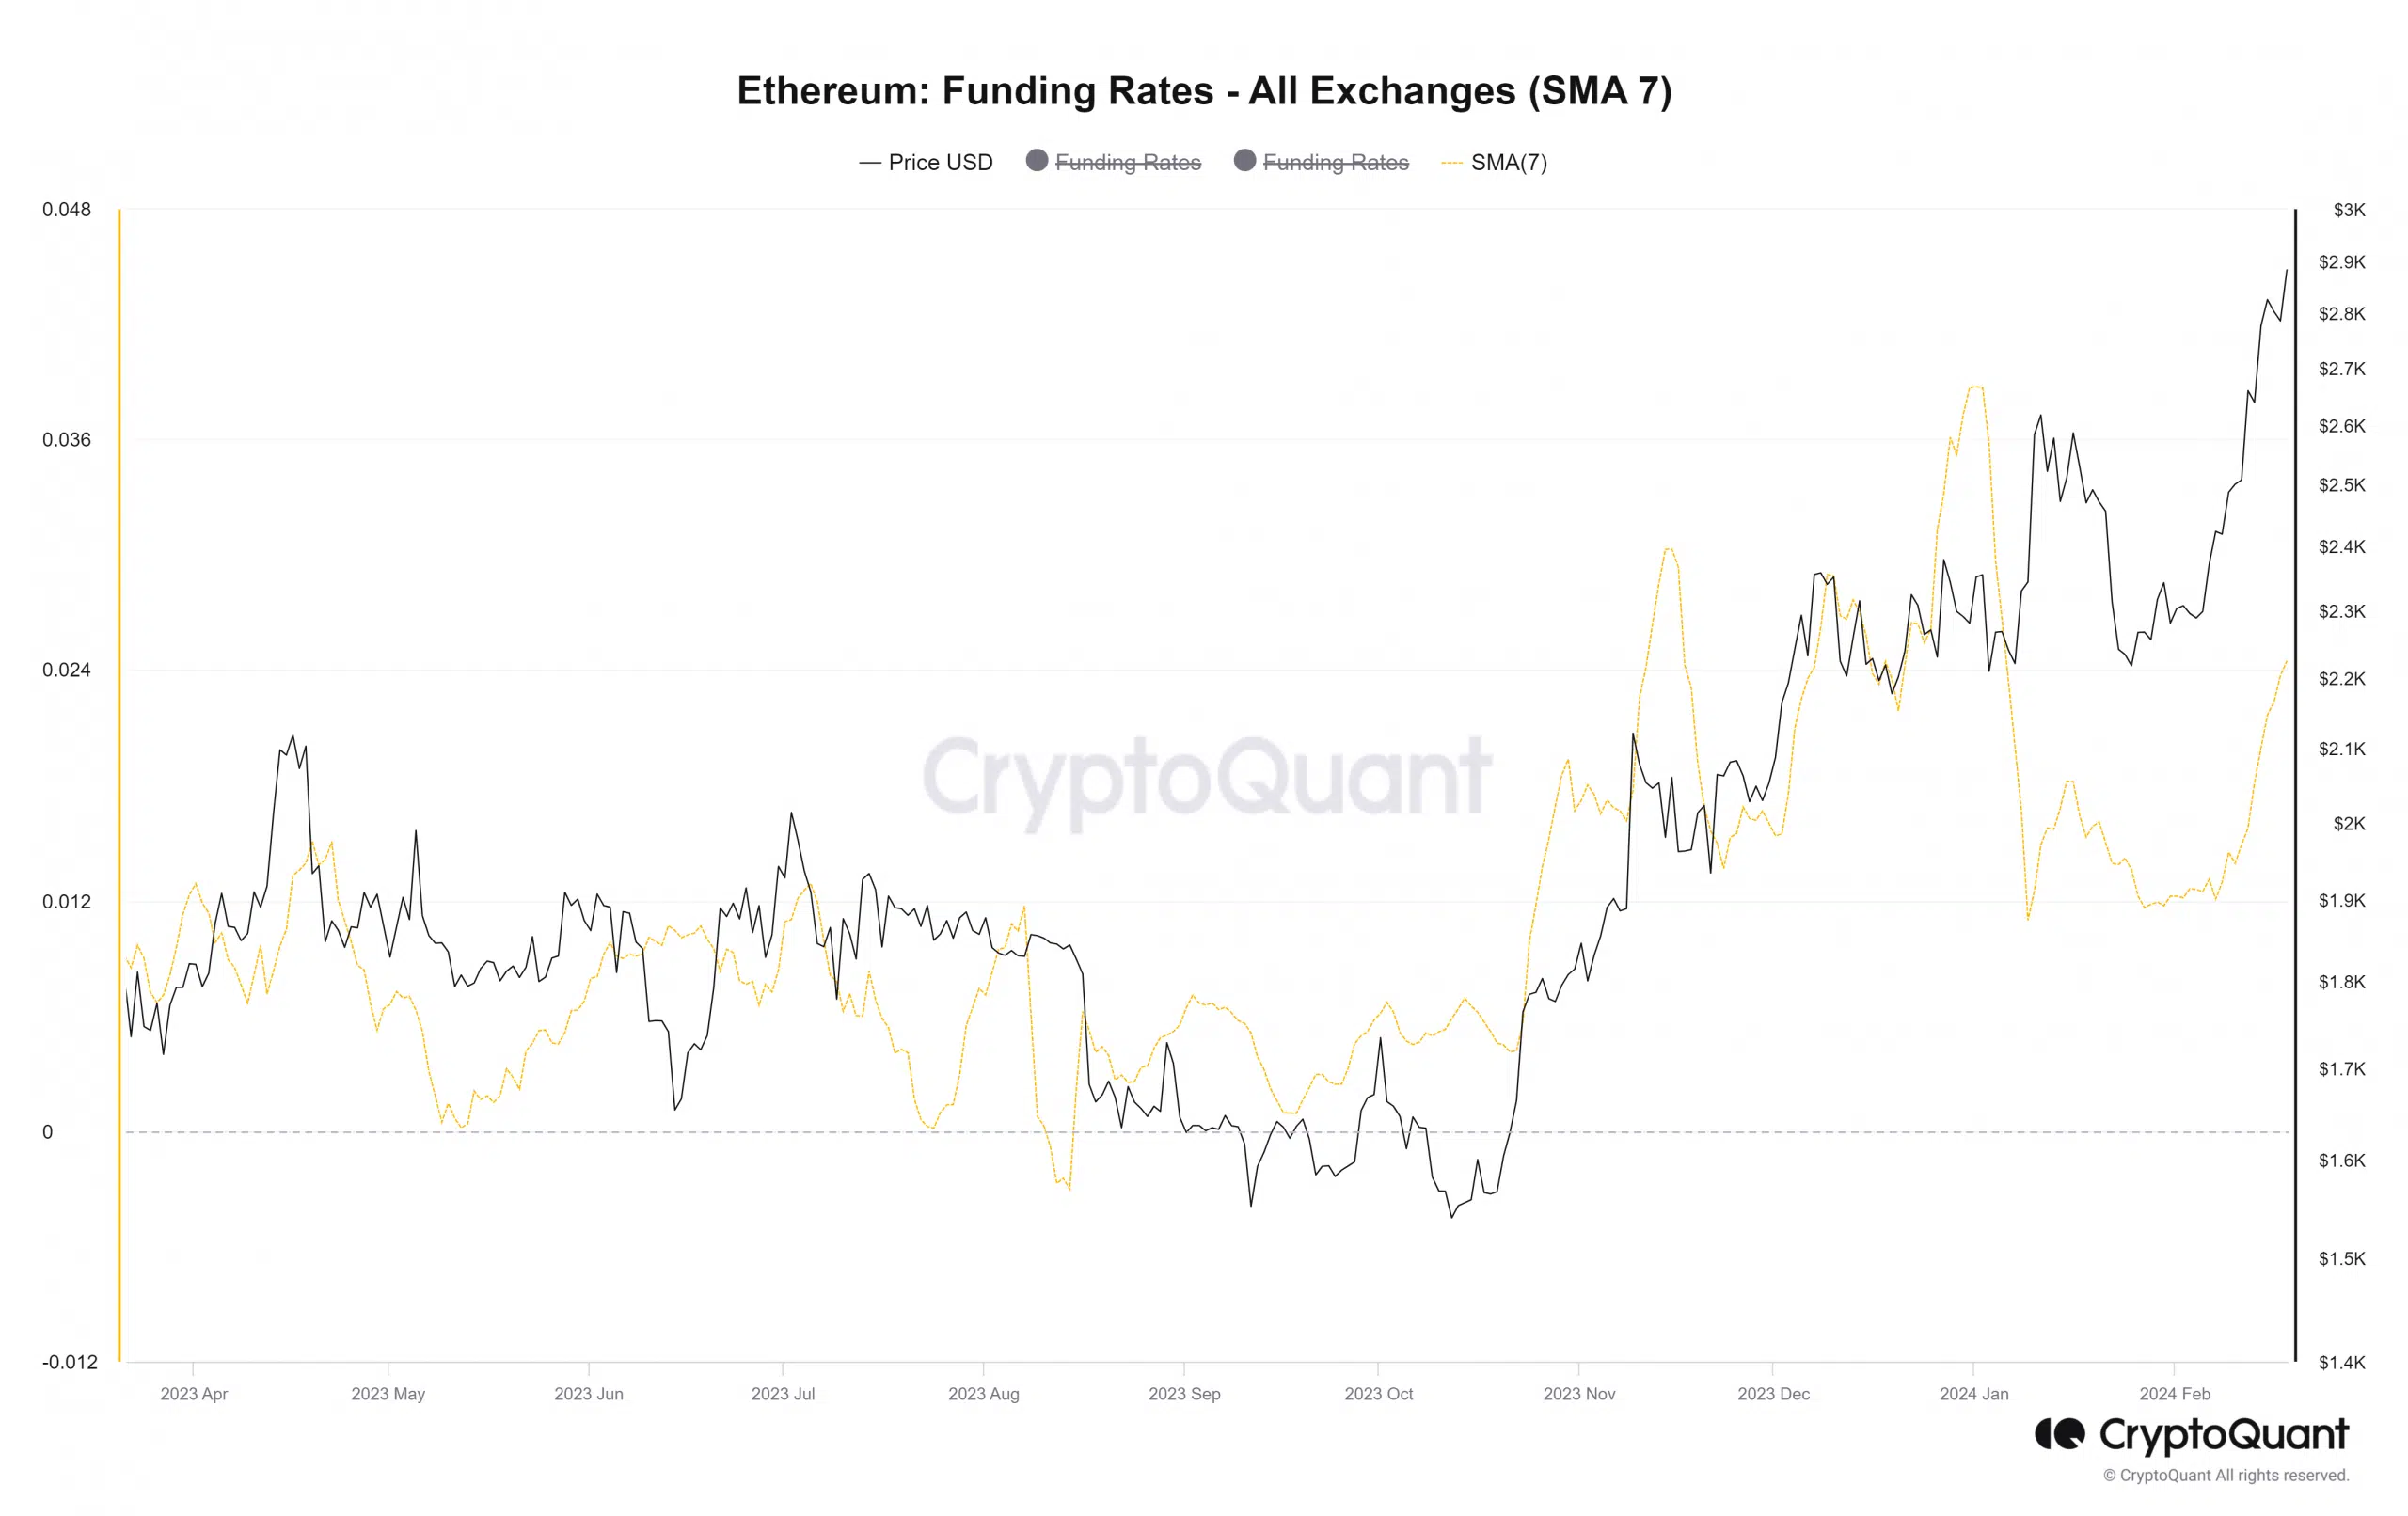
Source: CryptoQuant
The 7-day moving average of the funding rate also highlighted a similar story. It has been rising over the past month after a quiet January. Once again, the chart above reinforced the bullish expectations that market participants harbored.
The consolidation period in January was followed by an expansion upward in February. It was unclear how high the prices could go. However, the funding rate was not as overheated as it was in late December.
On 31st December, the funding rate pushed upward and nearly reached the highs from October 2021. This signaled a one-sided market as traders expected a breakout past the $2.4k resistance.
Instead, a correction to $2.1k came, followed by huge volatility in the lower timeframes to hunt the massive liquidation levels of overeager bulls and bears.
Where could Ethereum prices go next?
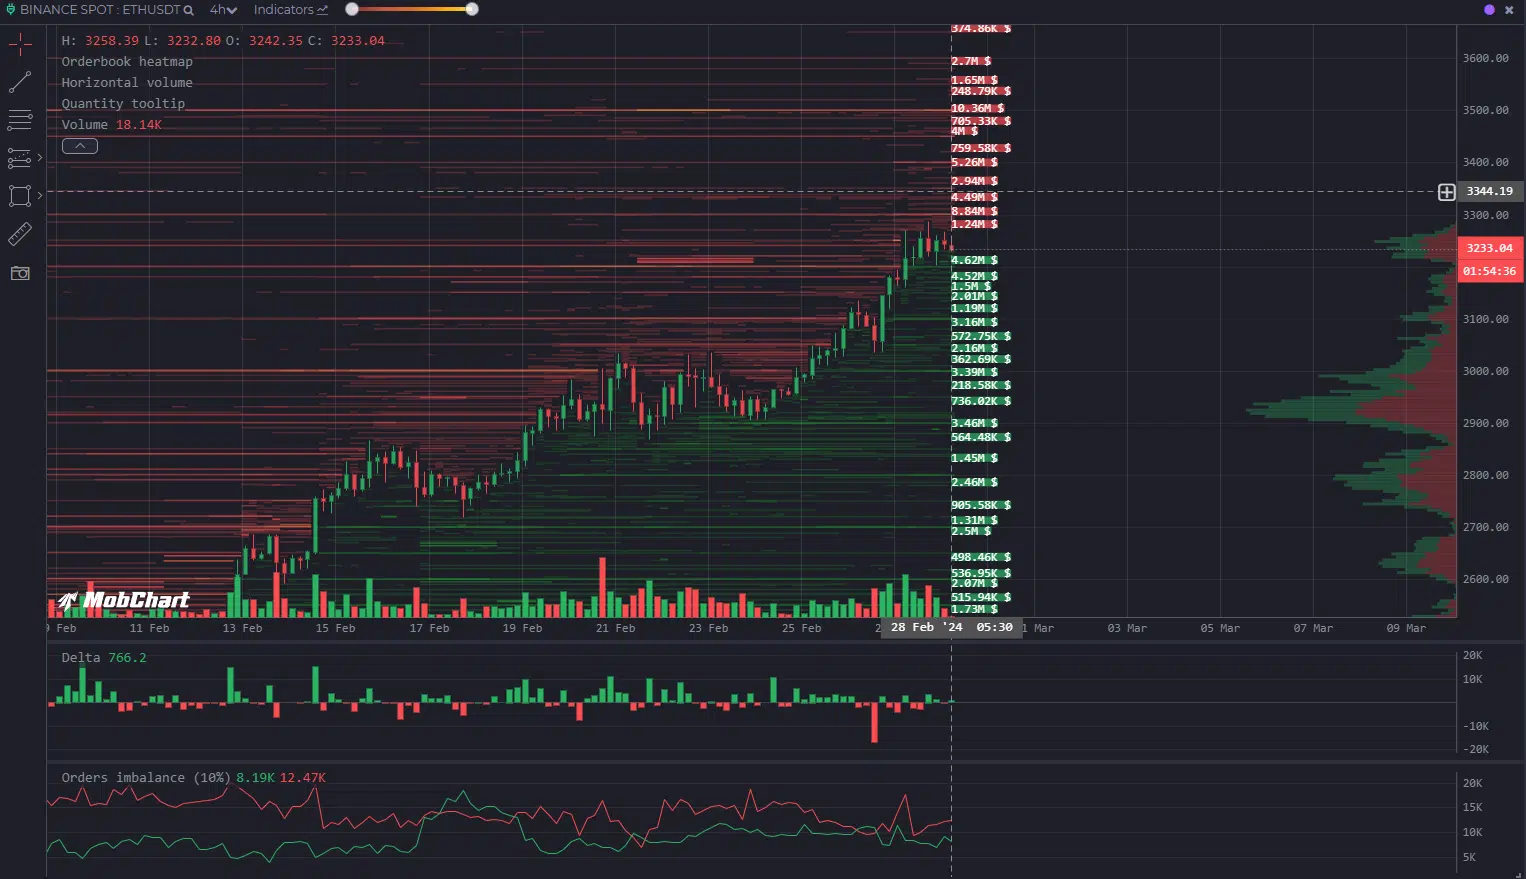
Source: MobChart
AMBCrypto analyzed the order book data from MobChart. The $3.3k level has $8.84 million worth of limit sell orders, with another $10.36 million at the $3.6k level.
Is your portfolio green? Check the ETH Profit Calculator
To the south, the round number support levels at $3.2k, $3.1k, and $3k had $4.77 million, $3.16 million, and $3.1 million worth of limit buy orders respectively. Therefore, these are the key levels to watch out for.
In other news, a recent AMBCrypto report highlighted the fact that the Ethereum demand remained high. On-chain metrics were positive and supported the idea of further gains.
- Data from the futures market showed strong bullish sentiment.
- Order book data highlighted key resistance and support levels.
Ethereum [ETH] had lagged behind Bitcoin [BTC] in the first two weeks of February. At that time ETH struggled to beat the $2.5k and $2.6k resistance levels while BTC soared past the $48k and $50k resistances.
Ethereum has caught up in terms of performance, and this was accompanied by a wild spike in speculative activity. Bulls were eager to score quick profits when they saw the strength of the momentum behind ETH.
The Open Interest reaches a nearly two-year high
Source: CryptoQuant
On April 5th, 2022, the OI of ETH reached the $7.6 billion level but plummeted swiftly in the next two months as Ethereum prices crashed from $3.4k to $1.2k. At the time of writing, the OI stood at $7.8 billion as prices reclaimed the psychological $3k level.
This was a clear sign that sentiment was firmly in favor of the buyers. Such rapid growth also leaves room for lower timeframe price volatility, so traders using high leverage must be extremely careful.
Source: CryptoQuant
The 7-day moving average of the funding rate also highlighted a similar story. It has been rising over the past month after a quiet January. Once again, the chart above reinforced the bullish expectations that market participants harbored.
The consolidation period in January was followed by an expansion upward in February. It was unclear how high the prices could go. However, the funding rate was not as overheated as it was in late December.
On 31st December, the funding rate pushed upward and nearly reached the highs from October 2021. This signaled a one-sided market as traders expected a breakout past the $2.4k resistance.
Instead, a correction to $2.1k came, followed by huge volatility in the lower timeframes to hunt the massive liquidation levels of overeager bulls and bears.
Where could Ethereum prices go next?
Source: MobChart
AMBCrypto analyzed the order book data from MobChart. The $3.3k level has $8.84 million worth of limit sell orders, with another $10.36 million at the $3.6k level.
Is your portfolio green? Check the ETH Profit Calculator
To the south, the round number support levels at $3.2k, $3.1k, and $3k had $4.77 million, $3.16 million, and $3.1 million worth of limit buy orders respectively. Therefore, these are the key levels to watch out for.
In other news, a recent AMBCrypto report highlighted the fact that the Ethereum demand remained high. On-chain metrics were positive and supported the idea of further gains.


Can you be more specific about the content of your article? After reading it, I still have some doubts. Hope you can help me.
Thanks for sharing. I read many of your blog posts, cool, your blog is very good.
Thanks for sharing. I read many of your blog posts, cool, your blog is very good.
where buy cheap clomid pill cost clomid prices clomiphene price in usa clomid sleep apnea clomid price in usa buying cheap clomiphene no prescription how to get cheap clomid without prescription
I couldn’t weather commenting. Adequately written!
This is the gentle of writing I positively appreciate.
buy azithromycin 250mg pill – generic tinidazole 300mg flagyl 400mg price
order generic semaglutide 14mg – periactin uk buy generic cyproheptadine over the counter
buy motilium – tetracycline usa order flexeril generic