


![What Is Asset Tokenization? Types, Why It Matters Now [2025]](https://coininsights.com/wp-content/uploads/2025/05/asset_tokenization-360x180.png)


Crypto trading can be a tough task. Not only will you have to face all the challenges associated with regular trading, you will also have to battle the additional volatility present in the crypto market.
Reversal candlestick patterns are one of the principal tools that a trader can use. These patterns can help identify bullish and bearish reversals in the market and find profitable trading opportunities.
Hello! I’m Zifa, a seasoned crypto writer with over three years in the field. Today, I bring you an all-encompassing guide on reversal candlestick patterns. We’ll explore what they are and how you can leverage them in your trading approach.
What Is a Reversal Candlestick Pattern?
A reversal candlestick pattern is a bullish or bearish reversal pattern formed by one or more candles. One can use these kinds of patterns to identify a potential reversal in assets’ prices.
Various candlestick reversal patterns exist, but not all of them are equally strong or reliable. Some of the most popular ones include the bullish engulfing pattern, the bearish engulfing pattern, the bullish harami pattern, and the bearish harami pattern.
Please note that we will be talking about candlesticks in this article. To learn more about their structure, read this article.
Bullish vs. Bearish Reversal Candles
Reversal candlestick patterns can be either bullish or bearish. Bullish reversal patterns occur when the market is in a downtrend and forms a bullish reversal pattern. Bearish reversal patterns occur when the market is in an uptrend and forms a bearish reversal pattern.
Complete List of All Reversal Candlestick Patterns: Cheat Sheet
Here’s a complete list of reversal candlestick patterns, including both bullish and bearish reversals:
Bullish Reversal Candlestick Patterns
- Hammer
- Inverse Hammer
- Bullish Engulfing
- Piercing Line
- Morning Star
- Morning Doji Star
- Three White Soldiers
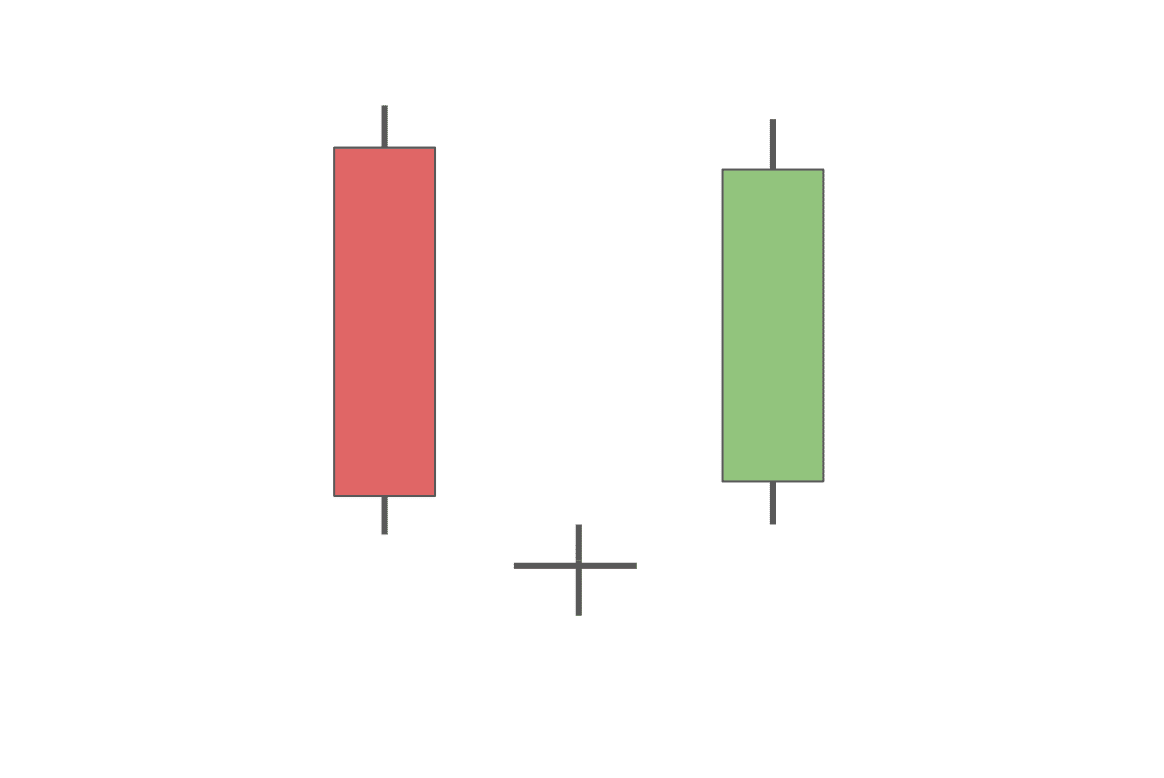
- Dragonfly Doji
- Tweezer Bottoms
- Abandoned Baby Bottom
- Bullish Harami
- Bullish Harami Cross
- Bullish Kicker
- Bullish Meeting Lines
- Three Inside Up
- Three Outside Up
- Bullish Stick Sandwich
- Bullish Breakaway
- Bullish Belt Hold
- Ladder Bottom
Bearish Reversal Candlestick Patterns
- Hanging Man
- Shooting Star
- Bearish Engulfing
- Evening Star
- Evening Doji Star
- Three Black Crows
- Gravestone Doji
- Dark Cloud Cover
- Tweezer Tops
- Abandoned Baby Top
- Bearish Harami
- Bearish Harami Cross
- Bearish Kicker
- Bearish Meeting Lines
- Three Inside Down
- Three Outside Down
- Bearish Stick Sandwich
- Bearish Breakaway
- Bearish Belt Hold
- Upside Gap Two Crows
Each pattern has its own unique formation and implications. We will take a closer look at the most popular patterns later in this article.
Read also: Chart patterns cheat sheet.
Candlestick Performance
Candlestick reversal patterns are among the most powerful bullish and bearish reversal signals in the market. Thanks to their high accuracy, these patterns can be used to trade both long and short positions.
In order to make the most of candlestick reversal patterns, you should use them in conjunction with indicators and comprehensive market and technical analysis. Don’t forget that no pattern or indicator is ever fully reliable per se.
Top Bullish Reversal Candlestick Patterns
Although they may sometimes be unreliable, learning how to identify the top bullish patterns that can signal reversal is still an immensely important skill for any crypto trader. Let’s review some of the most commonly seen ones and learn what they can mean.
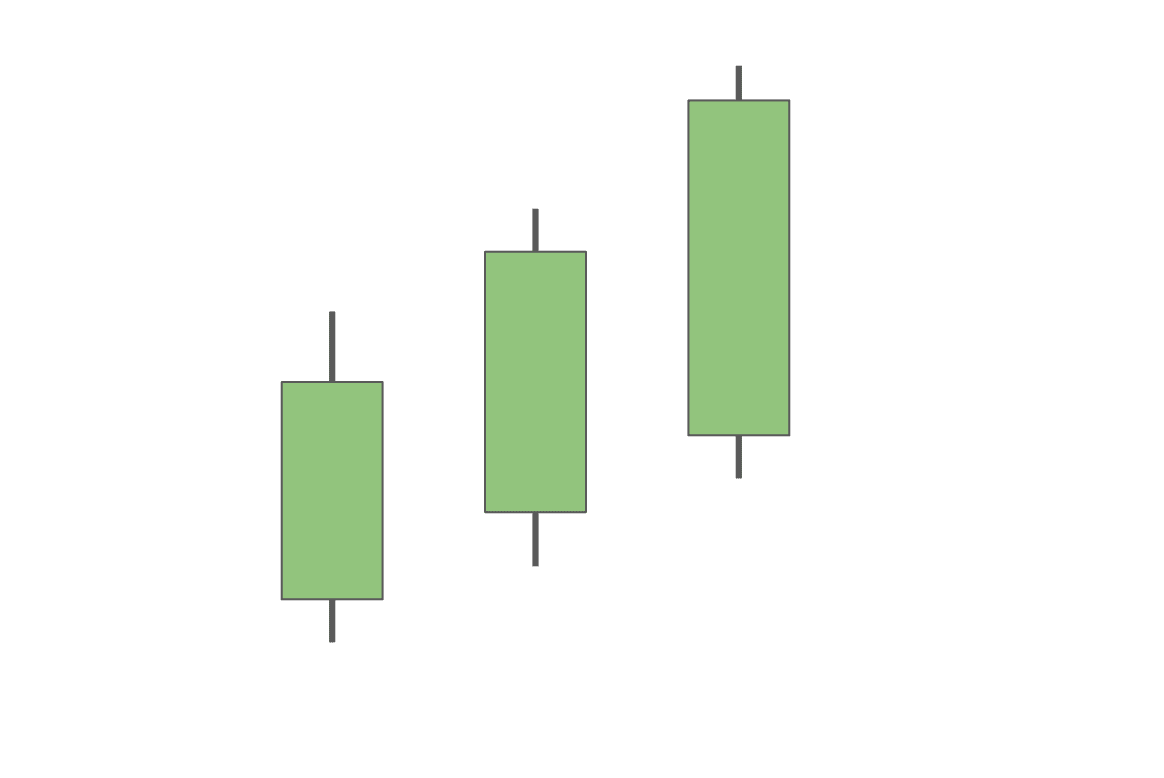
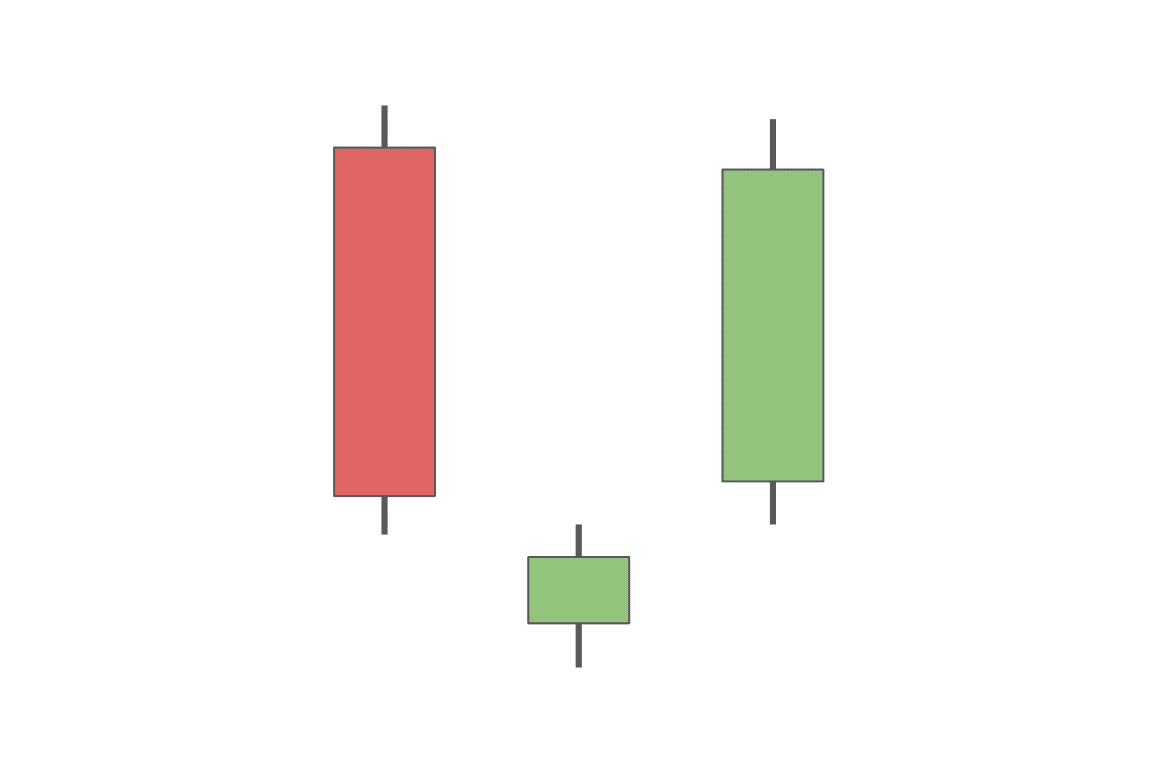
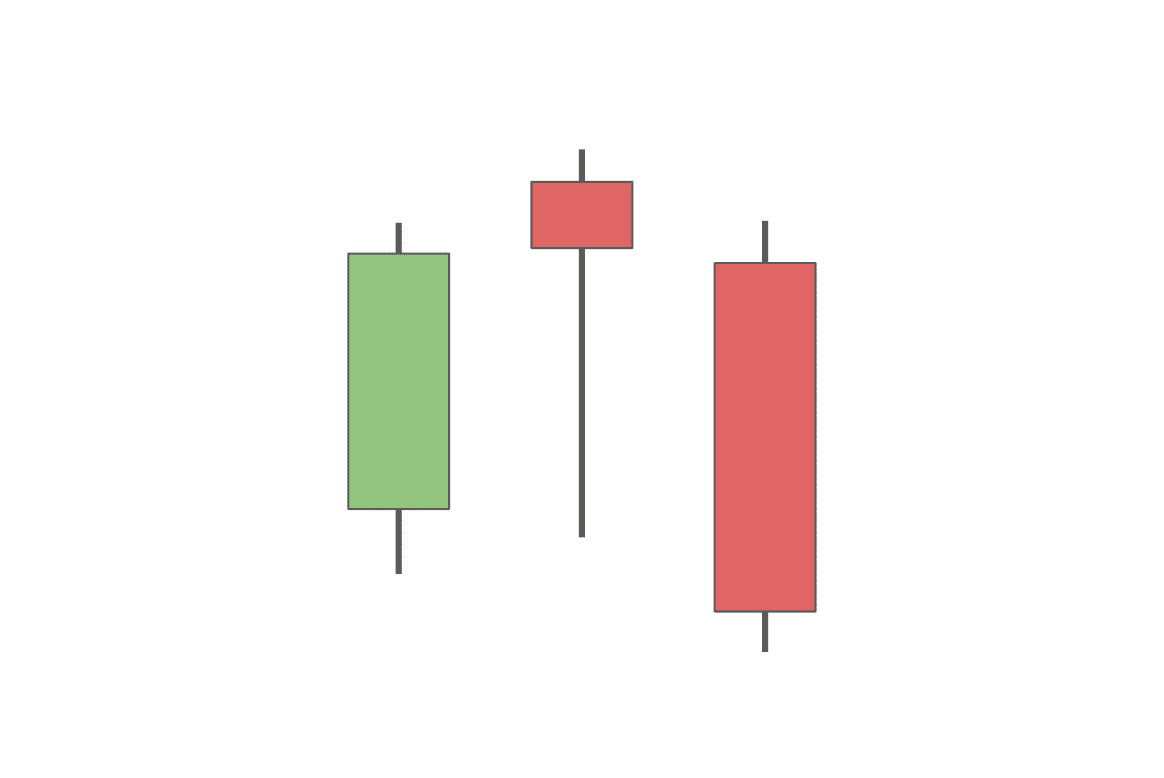
Three White Soldiers
Three white soldiers is one of the most famous three-candle reversal patterns. It is formed by three candlesticks that all have long bodies and a higher close than the previous candle. Three white soldiers all open within the body of the preceding candle. Additionally, they also have short wicks, which signifies relatively low volatility and a strong bullish trend.
The three white soldiers pattern usually comes after a downtrend and confirms that bulls have taken over the market.

Dragonfly Doji
The dragonfly doji is a bullish reversal pattern formed when the open, the high, and the close are all equal or very close to each other. It basically has no body. Instead, it has a really long lower wick but an almost non-existent upper one.
This pattern shows that although the asset’s value briefly went down during the set time frame due to selling pressure, it opened and closed at a high price. The dragonfly doji shows that the bulls currently have the upper hand in the market, and we may see a reversal from a bearish trend to a bullish one quite soon.
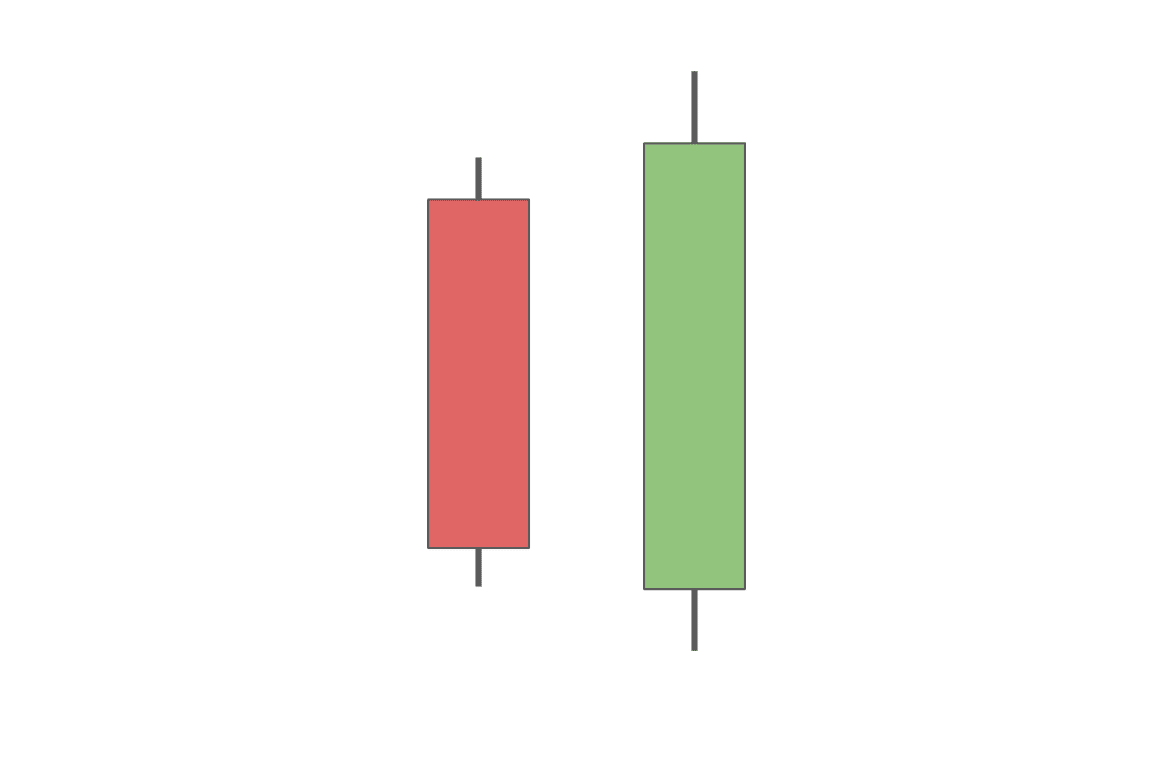
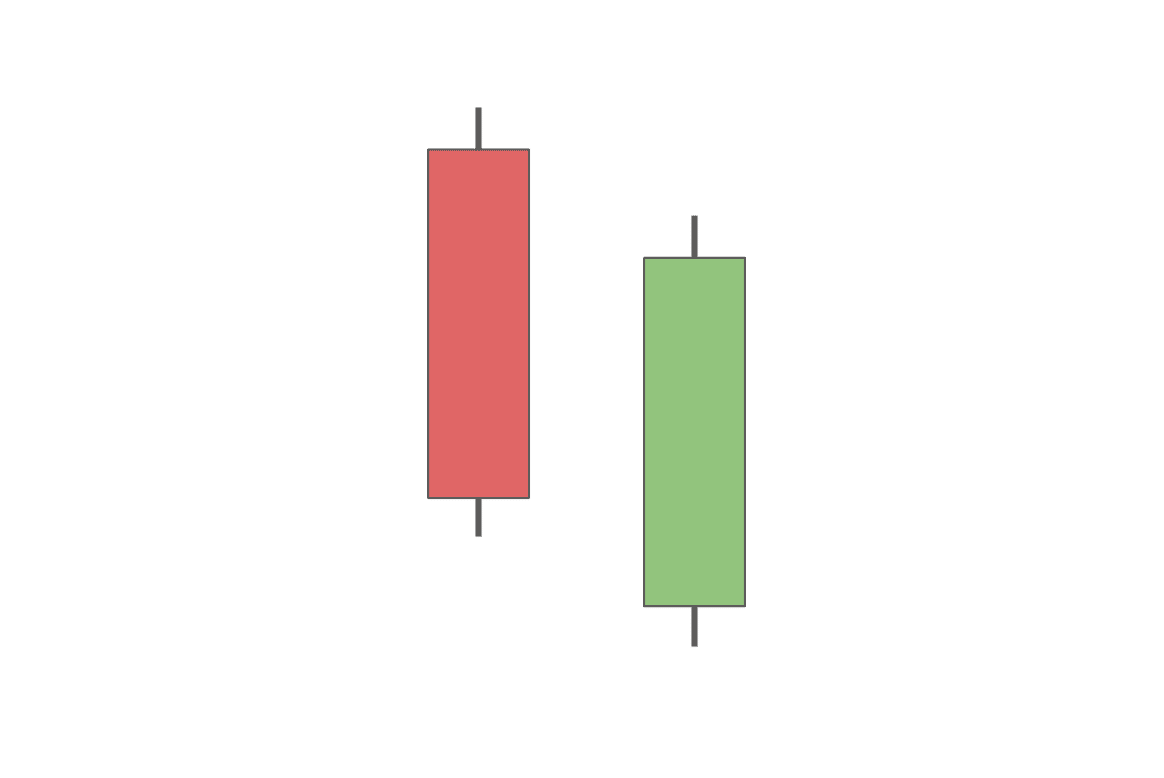
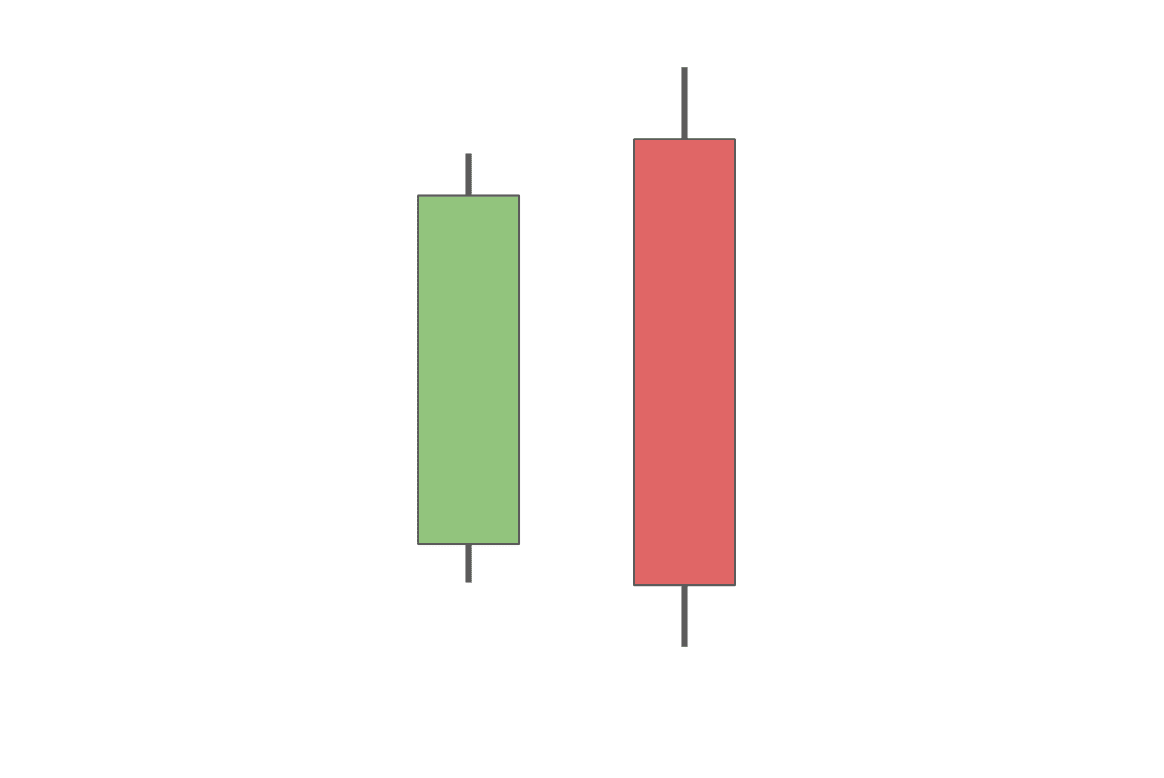
Bullish Engulfing
The bullish engulfing pattern is a rather simple pattern formed by two candlesticks. The first candlestick is bearish, and the second one is bullish. Just like the name suggests, the second candle engulfs the body of the first one.
The engulfing is considered to be one of the most powerful bullish reversal patterns as it shows that although the asset’s price touched a new low, it still managed to close above the opening of the preceding candle.
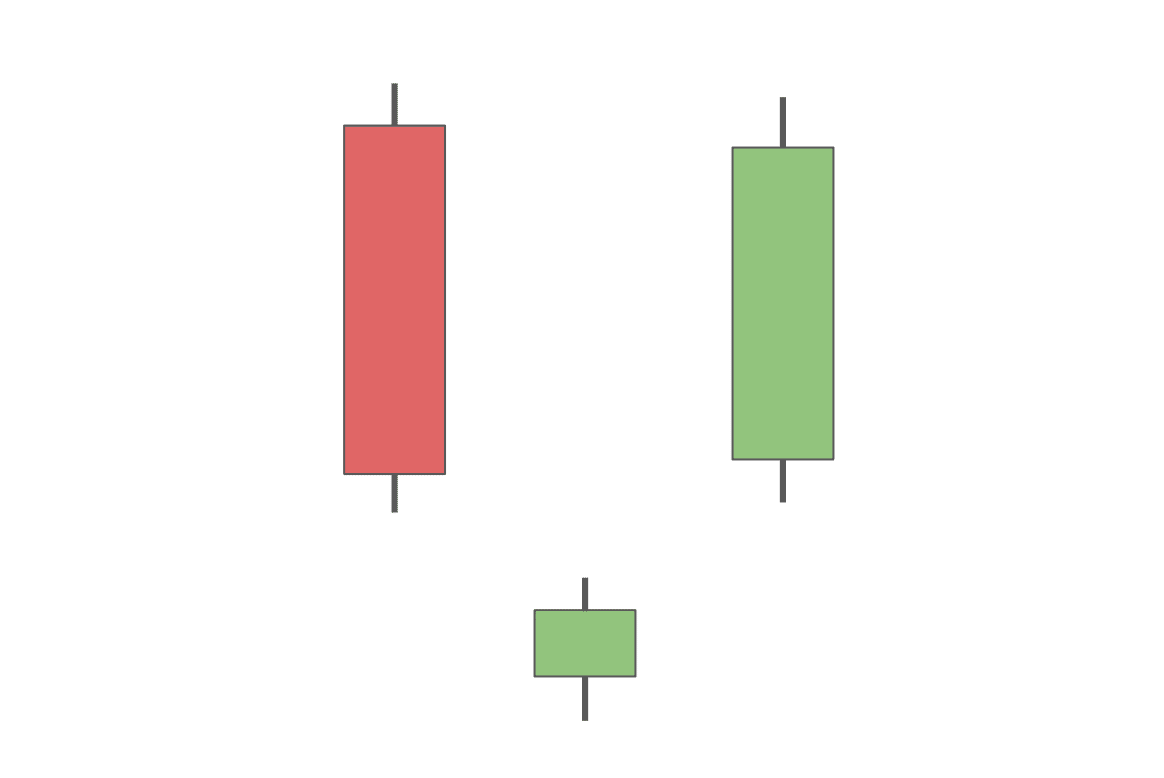
Bullish Abandoned Baby
The bullish abandoned baby is a bullish reversal pattern that consists of three candlesticks: one bearish and two bullish ones. It is really similar to the morning star but has one crucial difference. The abandoned baby — the second candle — is below the lower wicks of both the first and the third candlesticks in the pattern. Sometimes, there is more than one “baby” between the two big candles.
The small second candle shows that the selling pressure has become weaker. Its distance from the other two candles signals that selling pressure has possibly been exhausted.
Morning Star
The morning star is a bullish reversal pattern formed by three candlesticks. The first candlestick is bearish, the second one is a small bullish or bearish candlestick, and the third one is a big bullish candle.
The second candle ends up being so small because although there is a push to a new low, there is also a rebound, which receives bullish confirmation through the third big green candle.
Morning Doji Star
The morning doji star is very similar to the regular morning star. The main difference is that in this case, the second candle’s body is a lot smaller — it’s a doji. Its small body signals indecisiveness in the market, while its long wicks reflect the ongoing price volatility. These two factors combined, especially alongside the other elements of the morning star pattern, signal a possible reversal.
Piercing Line
The piercing line is formed by two candlesticks, a bearish and a bullish one, which both have average or large bodies and wicks of average length. The second candle’s low is always below that of the previous candle. Despite that, this bullish candlestick might signify the beginning of a rally.
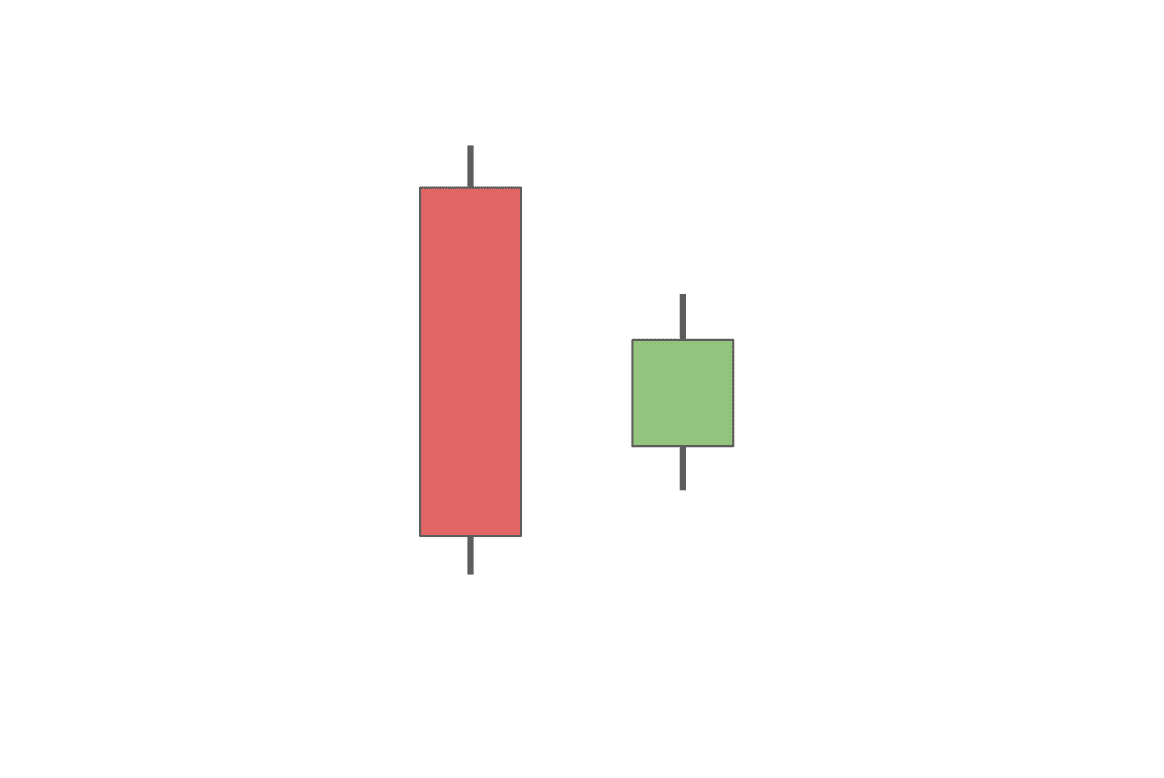
Bullish Harami
The bullish harami is formed by two candles, a bearish and a bullish one. The green candle is a lot smaller than the red one. This pattern signifies that there has possibly been a change in the market sentiment, and a rally may happen soon.
Hammer Candlestick
A hammer is one of the easiest patterns to spot: it has an easily recognizable shape and is made up of one single candlestick. This candle has a small body and a really long lower wick.
That long lower wick in conjunction with a short upper one and a body that’s on the smaller side gives a reversal signal. It shows that while the asset briefly traded really low, it managed to recover and continued being traded near its high point and above the opening.
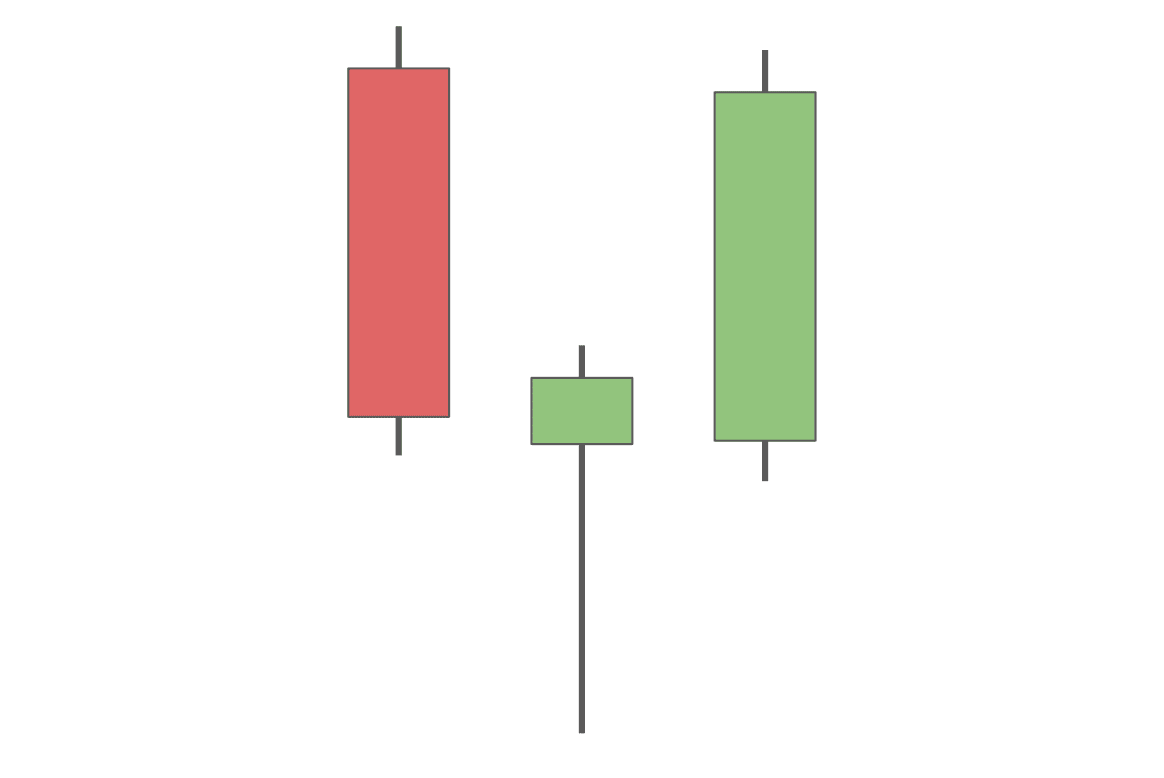
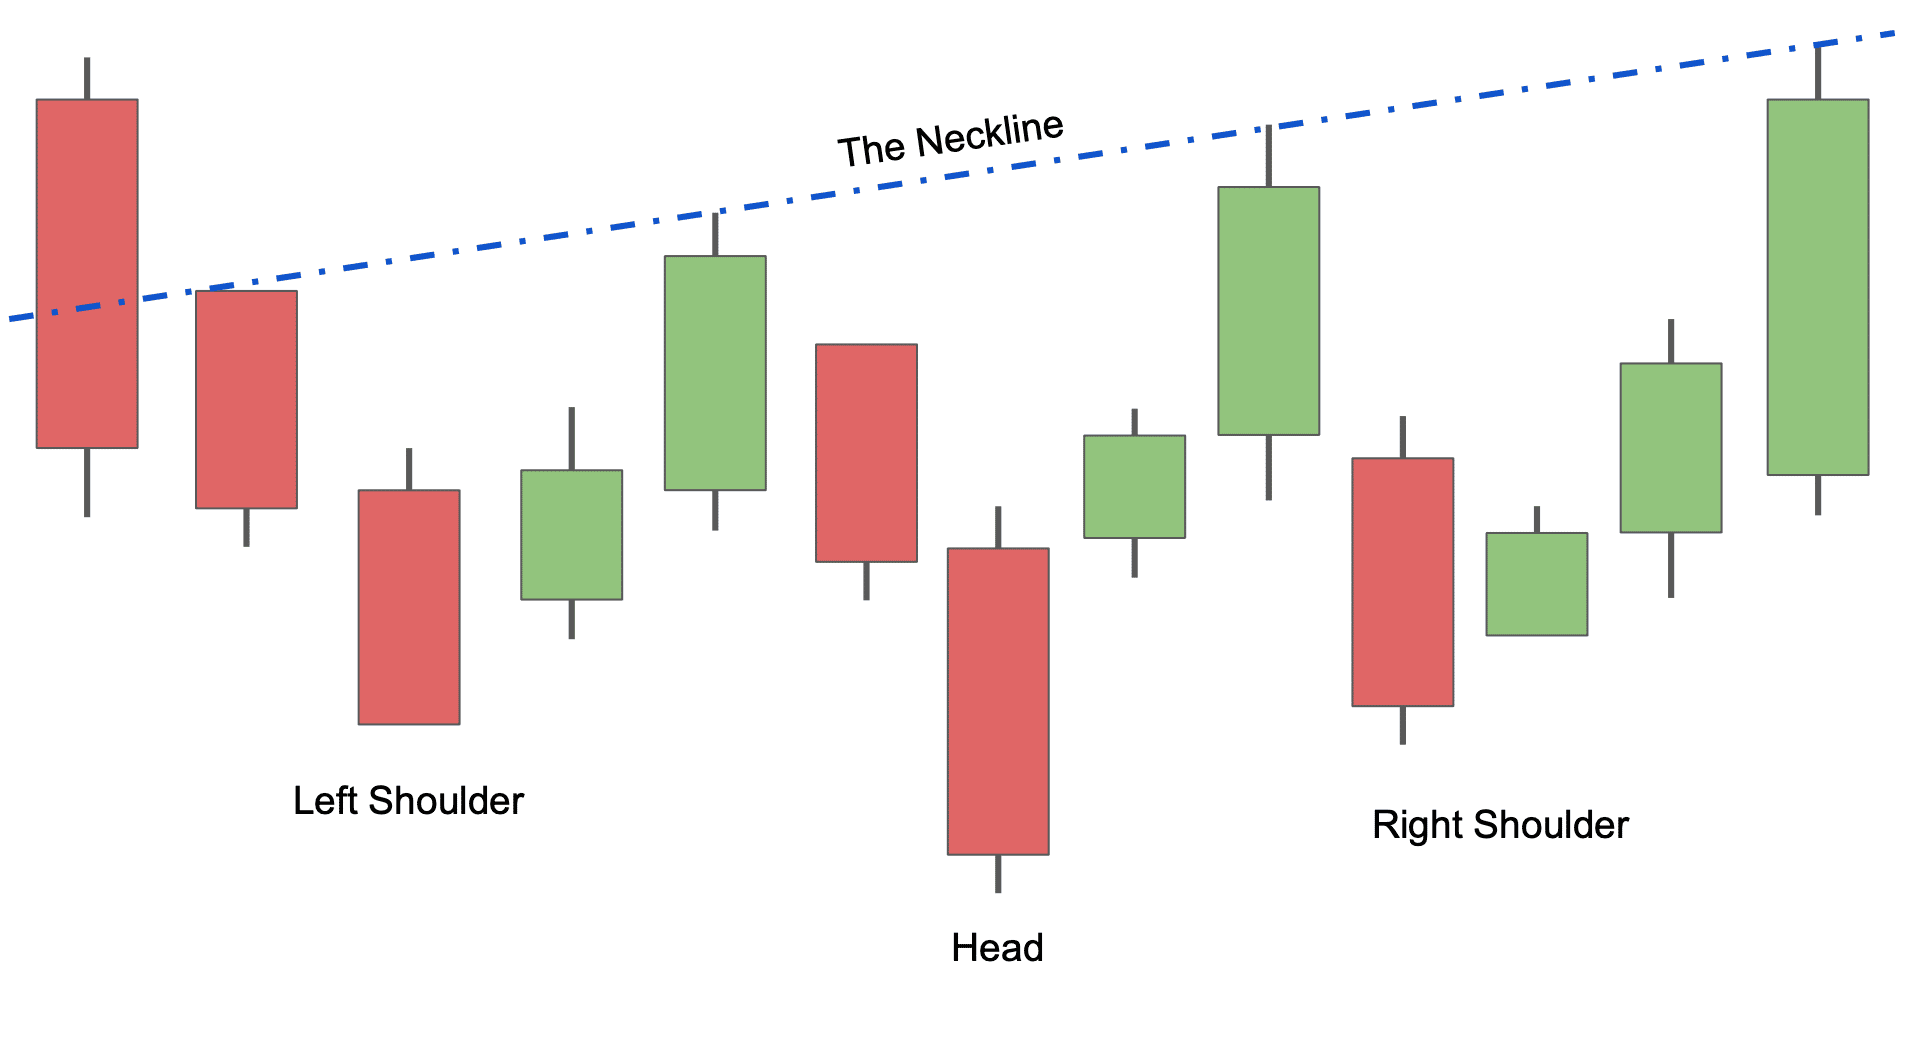
Inverse Head and Shoulders
The inverse head and shoulders is the most complex bullish reversal pattern on this list. Made up of multiple candles, it is usually recognized by its overall shape, which resembles three inverted triangles. The first one forms the left shoulder, the second one is the head, and the third one represents the right shoulder.
First, prices go down to a new minimum, which sparks a short-lived price rise. Then, the trend reverses, and the asset’s value goes even lower, only to shoot back up again and go back down again. These two high points are called the neckline. Finally, the asset goes up one final time and usually continues rising.
The complexity of this pattern makes it stronger: because it takes longer to be completed, the rallies that come after it usually tend to be stronger.
Top Bearish Reversal Candles
Now that we’ve examined bullish reversal candles, let’s take a look at some bearish reversal candles.
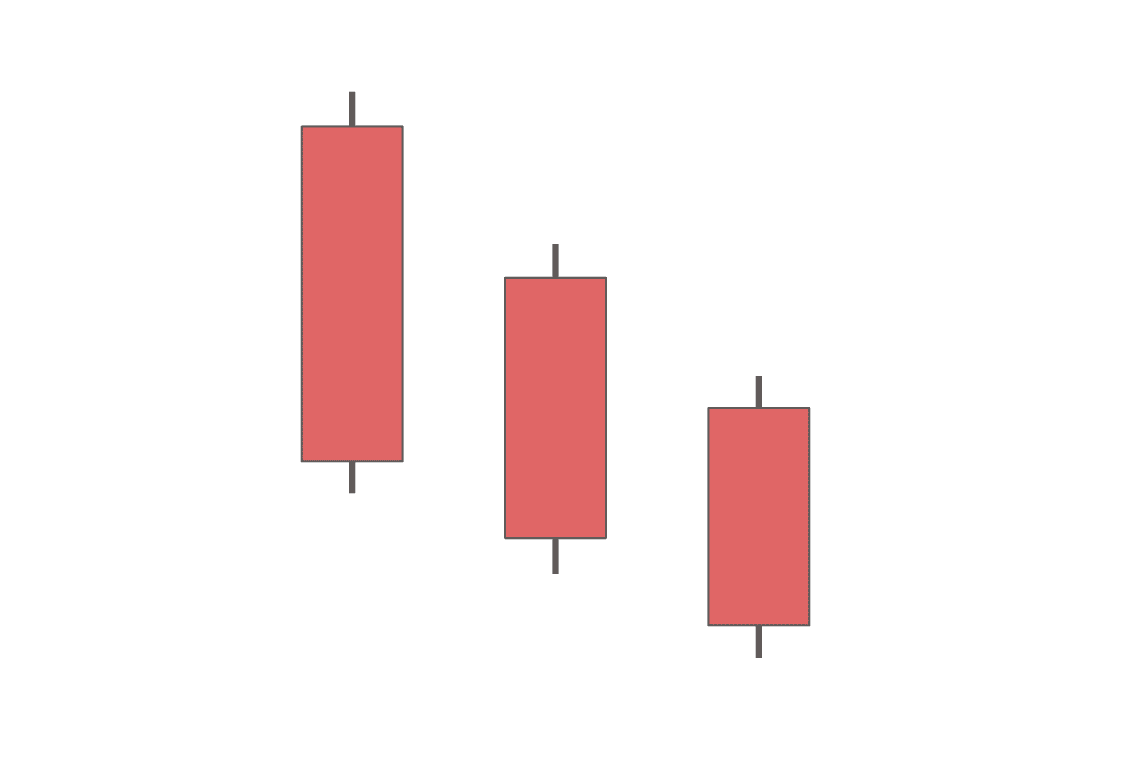
Three Black Crows
The three black crows is a bearish reversal pattern formed by three consecutive candlesticks with lower closes. All of them have small wicks — the opening price is generally also the highest, and the closing price is nearly the lowest.
That shows that the price continues to fall throughout the set time frame and keeps on going down within the candle. Three black crows is considered to be a really powerful bearish pattern. When preceded by a bullish trend, it signals a reversal.
Shooting Star Candlestick
The shooting star is a bearish reversal pattern formed by one candlestick with a small body, a long upper shadow, and a short lower shadow. It usually appears after a bullish trend and signals its ending.
This candlestick’s structure shows that although a new high has been hit, the trend is starting to reverse as there is not enough buying pressure.
Bearish Abandoned Baby
The bearish abandoned baby is similar to its bullish counterpart but turned upside down. Just like its cousin, it is also made up of three candles, with the middle one being relatively small.
The main difference between them is that in this pattern, the second candlestick is above the other two, not below. Additionally, the first candle will be green, and the third one will turn red, as this pattern signals the end of a rally and the beginning of a downtrend.
Evening Star
The evening star consists of three candlesticks. The first and the third candles both have a large body, while the middle one is rather small.
The first candlestick is bullish, and so is the second one. However, its small size shows that the rally has stalled, which is then confirmed by the third — bearish — candle. It usually signals the beginning of a downtrend.
Evening Doji Star
The evening doji star is very similar to the normal evening star pattern, but its second candle is a doji with an almost non-existent body. Just like the morning doji star, it shows indecisiveness in the market, although this time, it signals a possible reversal into a bearish direction.
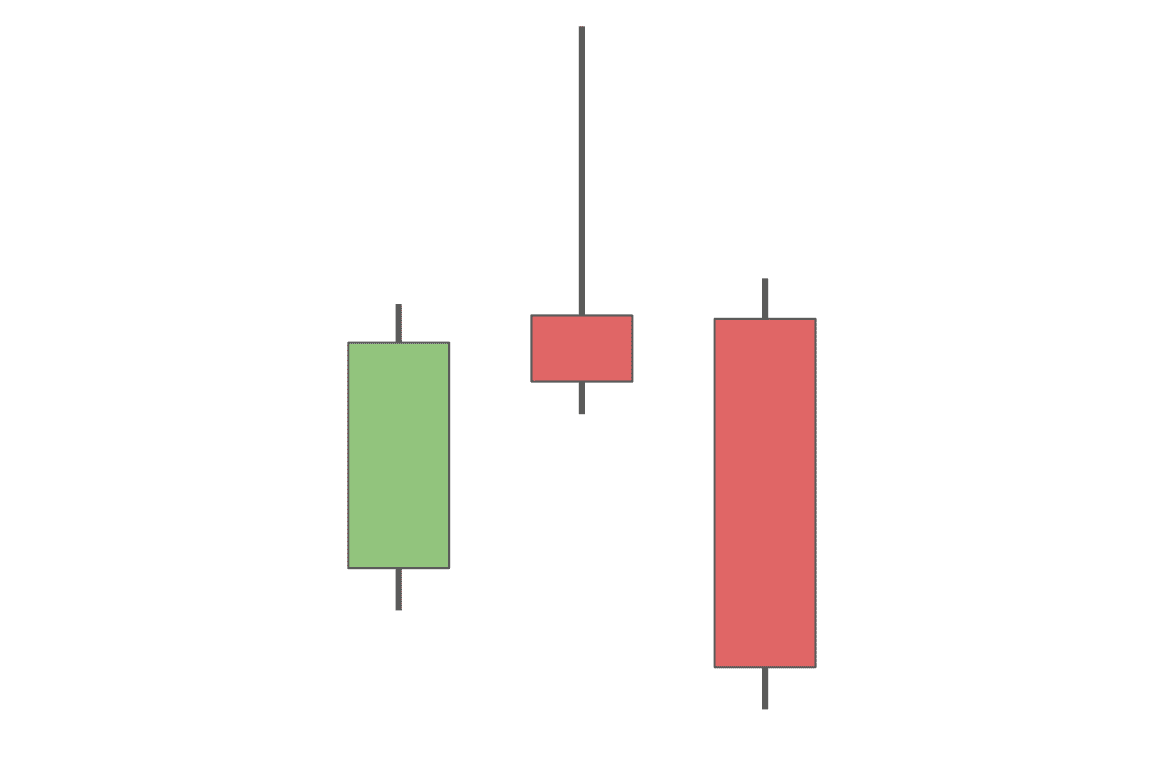
Dark Cloud Cover
The dark cloud cover is another strong pattern. It is formed by two candles, first a bullish and then a bearish one. Both of them are strong, with big bodies and average-sized wicks.
This pattern shows a situation in which the price of an asset tries to push to a new, higher position but ultimately fails and closes below its opening. It signals a bearish reversal trend.
Hanging Man Candlestick
The hanging man is formed by just one candlestick. It has a small body with a short upper wick and a long lower one. Essentially, it is the same as the hammer candle. This candlestick is called a hanging man when it comes at the end of a bull run. Just like its bullish counterpart, it signals a possible price reversal.
Bearish Engulfing
The bearish engulfing is the opposite of the bullish engulfing pattern. This time, it’s the bearish candle that engulfs the smaller body of the preceding bullish one. It shows that although the asset’s value briefly rallied above the highest point of the previous candlestick, it still closed below both its own opening and the opening price of the preceding candle. This usually leads to a bearish reversal.
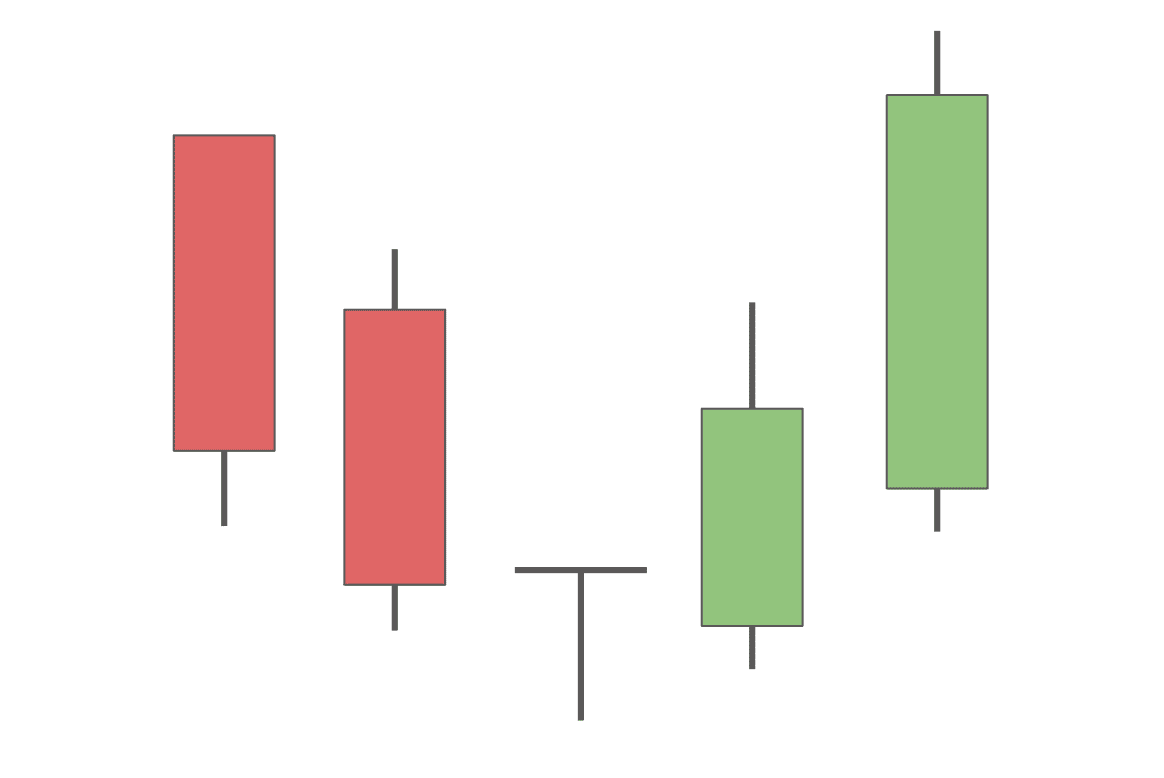
How Is Reversal Different from Retracement?
In trading, understanding the difference between a trend reversal and a retracement is key. A trend reversal signifies a significant change in the market’s direction, marking the end of an existing trend and the start of a new one. This shift is often identified by patterns like head and shoulders or double top/bottom, indicating a substantial change in market sentiment. These reversals usually have a longer duration and are critical in signaling new trends.
Contrastingly, a retracement is a temporary reversal within an ongoing trend. It’s seen as a minor market correction and is usually short-lived. Tools like Fibonacci retracement levels or moving averages help identify potential support or resistance levels during these movements. Unlike reversals, retracements don’t signify a complete trend change but are more like brief pauses in the existing trend.
How to Use Reversal Candlestick Patterns
Reversal candlestick patterns are vital for traders to spot shifts in market trends. Patterns like the bullish reversal doji, reversal hammer, and bearish engulfing pattern can indicate changes from bearish to bullish trends and vice versa.
Traders should use these patterns alongside confirmation signals, like a subsequent higher or lower candle close, to validate potential trend reversals. For instance, a bullish reversal doji following a downtrend may signal an upcoming uptrend, especially if followed by a higher closing candle.
What to Do When Reversal Candle Formations Appear
Upon spotting reversal candle formations, traders should act swiftly to assess potential market direction changes. Recognizing patterns such as bullish engulfing or shooting stars is crucial. The key is to understand these indicators and integrate them into your trading strategy effectively, managing open positions accordingly and potentially capitalizing on new market directions.
Entry Points
Identifying entry points involves recognizing single, dual, or three-candlestick patterns. Traders should enter a position in the direction of the reversal at the opening of the next candle, leveraging the potential trend change without awaiting further confirmation.
Stop Loss
A stop loss is an essential risk management tool. For bullish reversals, set it below the pattern’s low; for bearish reversals, above the pattern’s high. This strategy helps safeguard against market movements that oppose the anticipated trend.
Take Profit
Setting a take profit level involves verifying it’s at least twice the distance from the entry point to the stop loss. This ratio ensures a favorable risk-reward balance, aligning with your risk management strategy and maximizing potential gains while minimizing potential losses.
Are All Reversal Candles Reliable?
Reversal candles, popular in technical analysis, are not always reliable indicators of market reversals. While they can be useful, their effectiveness varies depending on several factors. The accuracy of these indicators often depends on the market context and the specific candlestick pattern being analyzed. For instance, an inverted hammer may indicate a potential rally in a downtrend, but it requires confirmation from subsequent trading periods to validate this prediction.
Traders should not solely rely on reversal candles for decision-making. Instead, they should consider these patterns as part of a broader trading strategy that includes other technical indicators and a thorough analysis of the current trend. Understanding the limitations of these patterns is crucial in preventing over-reliance on them and making more informed trading decisions.
Advantages and Limitations of Candlestick Patterns
Candlestick patterns are renowned for providing visual cues about bullish and bearish trends in the market, thus assisting traders in anticipating future price movements. Patterns like the morning doji star pattern and the hammer pattern can signal potential shifts in market sentiment, helping traders to identify potential entry and exit points.
On the other hand, there’s always one of the main limitations of candlestick patterns — their subjective interpretation. Interpretations of the same pattern might vary and lead to contrasting trading decisions.
Additionally, these patterns can sometimes produce false signals, particularly in volatile markets. To mitigate these limitations, it’s advisable to use candlestick patterns in conjunction with other forms of technical analysis, such as support levels, continuation patterns, and momentum oscillators. This multifaceted approach helps to validate the signals provided by candlestick patterns and enhance the reliability of trading predictions.
Common Mistakes to Avoid in Interpreting Candlestick Patterns
Interpreting candlestick patterns effectively is key to successful trading, but there are common mistakes that traders should be wary of.
One such mistake is analyzing these patterns in isolation without considering the broader market context. For instance, a Doji candle may indicate indecision in the market, but its significance is better understood when viewed in relation to the current trend and surrounding candlestick formations.
Another error is overlooking the importance of volume in validating candlestick patterns. High trading volume can reinforce the credibility of a pattern, such as a continuation candlestick pattern, indicating a stronger market commitment to the current trend or a potential reversal.
This holistic approach reduces the risk of misinterpretation and allows for more accurate and dependable trading decisions.
What Is the 3 Candle Reversal Strategy?
The 3 candle reversal strategy is a technical analysis method used in trading to identify potential reversals in the market trend. It’s based on the observation and interpretation of a specific sequence of three candlesticks on a chart. Here’s how it typically works:
- Identification of a Trend: The first step involves identifying the prevailing trend in the market, whether it’s upward (bullish) or downward (bearish). This strategy is most effective when applied after a strong and clear trend.
- The Three Candle Pattern: The strategy looks for a specific pattern of three candles:
- First Candle: This is in line with the current trend. For a bullish trend, this would be an upward candle (usually green), and for a bearish trend, a downward candle (usually red).
- Second Candle: This candle starts to show the reversal. In a bullish trend, it would open higher but close below the midpoint of the first candle. In a bearish trend, it would open lower but close above the midpoint of the first candle.
- Third Candle: The key candle that confirms the reversal. For a bullish trend reversal, this candle should close well into the body of the first candle (ideally below it). For a bearish trend reversal, it should close well above the body of the first candle.
- Confirmation and Entry: Traders look for additional confirmation signals on the fourth candle or through other technical indicators like volume, support and resistance levels, or momentum indicators. Entry points are often considered at the close of the third candle or the open of the fourth, depending on confirmation.
- Risk Management: As with all trading strategies, risk management is crucial. This involves setting appropriate stop-loss orders and take-profit targets to protect against potential losses and lock in profits.
The 3 candle reversal strategy is popular because it’s relatively simple and can be applied across various time frames and markets. However, it’s important to note that no strategy guarantees success, and this approach should be used in conjunction with other analysis tools and a clear understanding of market conditions.
FAQ
What is the best time frame for day trading?
The 15-minute time frame is the best one for day trading. It is short enough to allow you to make quick decisions yet long enough to give you a good idea of what is going on in the market.
What is the best indicator for trend reversal?
There is no one best indicator for trend reversal. Some popular indicators that can be used to identify trend reversals are the moving average convergence divergence (MACD) indicator, the relative strength index (RSI) indicator, and the stochastic oscillator.
What’s bullish reversal strength?
The strength of a bullish reversal refers to the likelihood of the reversal actually happening.
What is a reversal candlestick pattern?
A reversal candlestick pattern is a formation that occurs on a candlestick chart indicating a potential change in the market direction. There are bullish and bearish reversal patterns.
How do you spot a reverse candle?
The best way to spot reserve candles is to memorize the most common patterns, such as the bearish and the bullish engulfing, three white soldiers, three black crows, and so on.
What is the strongest reversal candlestick pattern?
Some of the most powerful candlestick patterns include the bullish engulfing pattern, the morning star pattern, and the evening star pattern. These patterns tend to be more reliable than other ones.
What are bullish reversal candlestick patterns?
Bullish candlestick reversal patterns are formations that occur on a candlestick chart indicating a potential change in the market direction from bearish to bullish.
Disclaimer: Please note that the contents of this article are not financial or investing advice. The information provided in this article is the author’s opinion only and should not be considered as offering trading or investing recommendations. We do not make any warranties about the completeness, reliability and accuracy of this information. The cryptocurrency market suffers from high volatility and occasional arbitrary movements. Any investor, trader, or regular crypto users should research multiple viewpoints and be familiar with all local regulations before committing to an investment.
Crypto trading can be a tough task. Not only will you have to face all the challenges associated with regular trading, you will also have to battle the additional volatility present in the crypto market.
Reversal candlestick patterns are one of the principal tools that a trader can use. These patterns can help identify bullish and bearish reversals in the market and find profitable trading opportunities.
Hello! I’m Zifa, a seasoned crypto writer with over three years in the field. Today, I bring you an all-encompassing guide on reversal candlestick patterns. We’ll explore what they are and how you can leverage them in your trading approach.
What Is a Reversal Candlestick Pattern?
A reversal candlestick pattern is a bullish or bearish reversal pattern formed by one or more candles. One can use these kinds of patterns to identify a potential reversal in assets’ prices.
Various candlestick reversal patterns exist, but not all of them are equally strong or reliable. Some of the most popular ones include the bullish engulfing pattern, the bearish engulfing pattern, the bullish harami pattern, and the bearish harami pattern.
Please note that we will be talking about candlesticks in this article. To learn more about their structure, read this article.
Bullish vs. Bearish Reversal Candles
Reversal candlestick patterns can be either bullish or bearish. Bullish reversal patterns occur when the market is in a downtrend and forms a bullish reversal pattern. Bearish reversal patterns occur when the market is in an uptrend and forms a bearish reversal pattern.
Complete List of All Reversal Candlestick Patterns: Cheat Sheet
Here’s a complete list of reversal candlestick patterns, including both bullish and bearish reversals:
Bullish Reversal Candlestick Patterns
- Hammer
- Inverse Hammer
- Bullish Engulfing
- Piercing Line
- Morning Star
- Morning Doji Star
- Three White Soldiers
- Dragonfly Doji
- Tweezer Bottoms
- Abandoned Baby Bottom
- Bullish Harami
- Bullish Harami Cross
- Bullish Kicker
- Bullish Meeting Lines
- Three Inside Up
- Three Outside Up
- Bullish Stick Sandwich
- Bullish Breakaway
- Bullish Belt Hold
- Ladder Bottom
Bearish Reversal Candlestick Patterns
- Hanging Man
- Shooting Star
- Bearish Engulfing
- Evening Star
- Evening Doji Star
- Three Black Crows
- Gravestone Doji
- Dark Cloud Cover
- Tweezer Tops
- Abandoned Baby Top
- Bearish Harami
- Bearish Harami Cross
- Bearish Kicker
- Bearish Meeting Lines
- Three Inside Down
- Three Outside Down
- Bearish Stick Sandwich
- Bearish Breakaway
- Bearish Belt Hold
- Upside Gap Two Crows
Each pattern has its own unique formation and implications. We will take a closer look at the most popular patterns later in this article.
Read also: Chart patterns cheat sheet.
Candlestick Performance
Candlestick reversal patterns are among the most powerful bullish and bearish reversal signals in the market. Thanks to their high accuracy, these patterns can be used to trade both long and short positions.
In order to make the most of candlestick reversal patterns, you should use them in conjunction with indicators and comprehensive market and technical analysis. Don’t forget that no pattern or indicator is ever fully reliable per se.
Top Bullish Reversal Candlestick Patterns
Although they may sometimes be unreliable, learning how to identify the top bullish patterns that can signal reversal is still an immensely important skill for any crypto trader. Let’s review some of the most commonly seen ones and learn what they can mean.
Three White Soldiers
Three white soldiers is one of the most famous three-candle reversal patterns. It is formed by three candlesticks that all have long bodies and a higher close than the previous candle. Three white soldiers all open within the body of the preceding candle. Additionally, they also have short wicks, which signifies relatively low volatility and a strong bullish trend.
The three white soldiers pattern usually comes after a downtrend and confirms that bulls have taken over the market.
Dragonfly Doji
The dragonfly doji is a bullish reversal pattern formed when the open, the high, and the close are all equal or very close to each other. It basically has no body. Instead, it has a really long lower wick but an almost non-existent upper one.
This pattern shows that although the asset’s value briefly went down during the set time frame due to selling pressure, it opened and closed at a high price. The dragonfly doji shows that the bulls currently have the upper hand in the market, and we may see a reversal from a bearish trend to a bullish one quite soon.
Bullish Engulfing
The bullish engulfing pattern is a rather simple pattern formed by two candlesticks. The first candlestick is bearish, and the second one is bullish. Just like the name suggests, the second candle engulfs the body of the first one.
The engulfing is considered to be one of the most powerful bullish reversal patterns as it shows that although the asset’s price touched a new low, it still managed to close above the opening of the preceding candle.
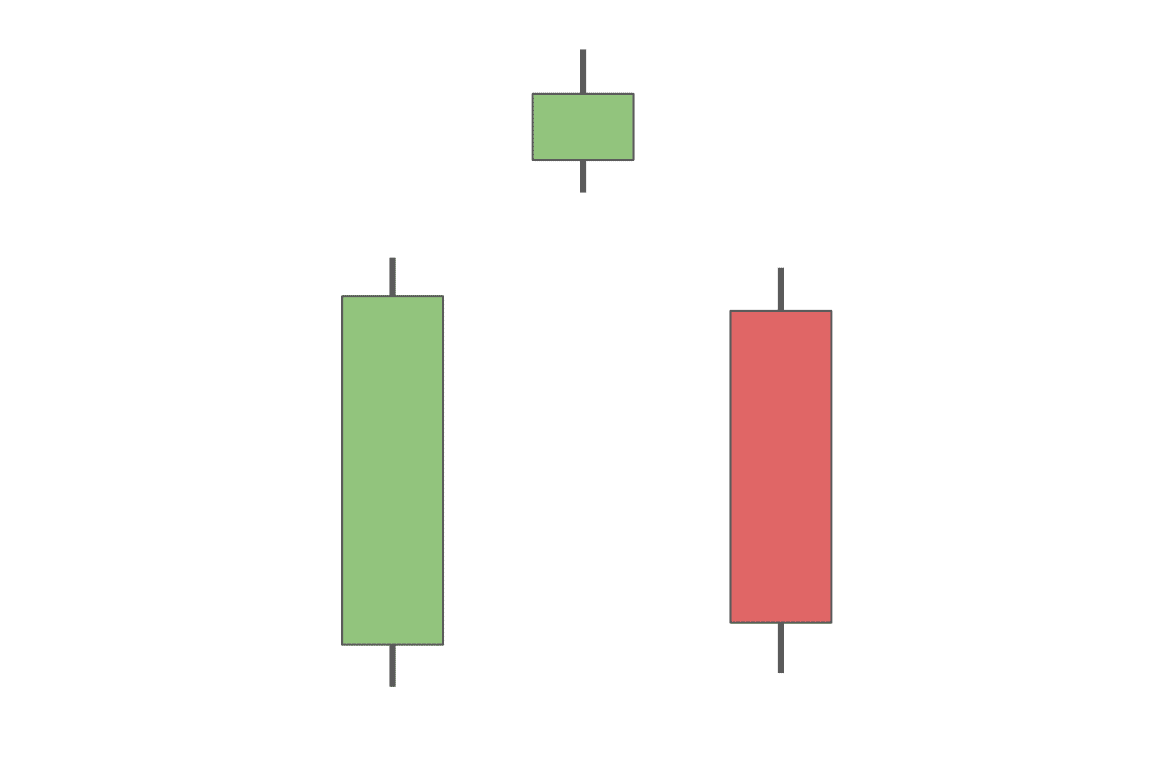
Bullish Abandoned Baby
The bullish abandoned baby is a bullish reversal pattern that consists of three candlesticks: one bearish and two bullish ones. It is really similar to the morning star but has one crucial difference. The abandoned baby — the second candle — is below the lower wicks of both the first and the third candlesticks in the pattern. Sometimes, there is more than one “baby” between the two big candles.
The small second candle shows that the selling pressure has become weaker. Its distance from the other two candles signals that selling pressure has possibly been exhausted.
Morning Star
The morning star is a bullish reversal pattern formed by three candlesticks. The first candlestick is bearish, the second one is a small bullish or bearish candlestick, and the third one is a big bullish candle.
The second candle ends up being so small because although there is a push to a new low, there is also a rebound, which receives bullish confirmation through the third big green candle.
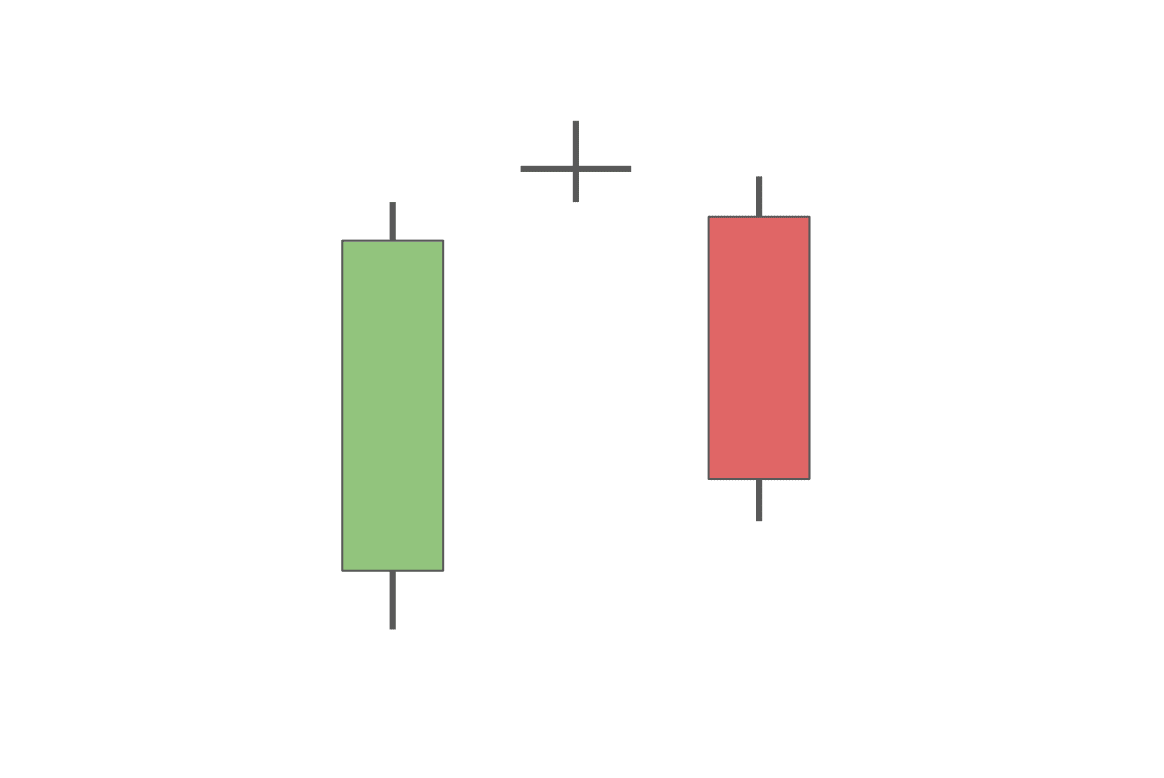
Morning Doji Star
The morning doji star is very similar to the regular morning star. The main difference is that in this case, the second candle’s body is a lot smaller — it’s a doji. Its small body signals indecisiveness in the market, while its long wicks reflect the ongoing price volatility. These two factors combined, especially alongside the other elements of the morning star pattern, signal a possible reversal.
Piercing Line
The piercing line is formed by two candlesticks, a bearish and a bullish one, which both have average or large bodies and wicks of average length. The second candle’s low is always below that of the previous candle. Despite that, this bullish candlestick might signify the beginning of a rally.
Bullish Harami
The bullish harami is formed by two candles, a bearish and a bullish one. The green candle is a lot smaller than the red one. This pattern signifies that there has possibly been a change in the market sentiment, and a rally may happen soon.
Hammer Candlestick
A hammer is one of the easiest patterns to spot: it has an easily recognizable shape and is made up of one single candlestick. This candle has a small body and a really long lower wick.
That long lower wick in conjunction with a short upper one and a body that’s on the smaller side gives a reversal signal. It shows that while the asset briefly traded really low, it managed to recover and continued being traded near its high point and above the opening.
Inverse Head and Shoulders
The inverse head and shoulders is the most complex bullish reversal pattern on this list. Made up of multiple candles, it is usually recognized by its overall shape, which resembles three inverted triangles. The first one forms the left shoulder, the second one is the head, and the third one represents the right shoulder.
First, prices go down to a new minimum, which sparks a short-lived price rise. Then, the trend reverses, and the asset’s value goes even lower, only to shoot back up again and go back down again. These two high points are called the neckline. Finally, the asset goes up one final time and usually continues rising.
The complexity of this pattern makes it stronger: because it takes longer to be completed, the rallies that come after it usually tend to be stronger.
Top Bearish Reversal Candles
Now that we’ve examined bullish reversal candles, let’s take a look at some bearish reversal candles.
Three Black Crows
The three black crows is a bearish reversal pattern formed by three consecutive candlesticks with lower closes. All of them have small wicks — the opening price is generally also the highest, and the closing price is nearly the lowest.
That shows that the price continues to fall throughout the set time frame and keeps on going down within the candle. Three black crows is considered to be a really powerful bearish pattern. When preceded by a bullish trend, it signals a reversal.
Shooting Star Candlestick
The shooting star is a bearish reversal pattern formed by one candlestick with a small body, a long upper shadow, and a short lower shadow. It usually appears after a bullish trend and signals its ending.
This candlestick’s structure shows that although a new high has been hit, the trend is starting to reverse as there is not enough buying pressure.
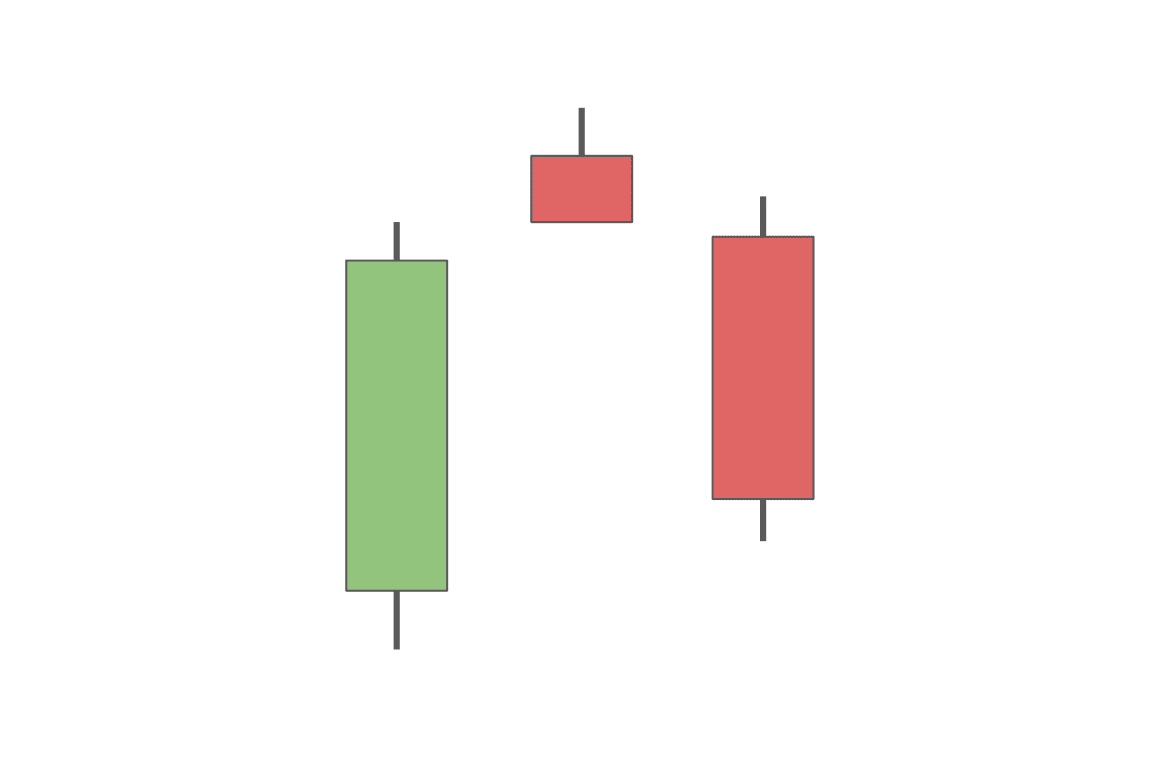
Bearish Abandoned Baby
The bearish abandoned baby is similar to its bullish counterpart but turned upside down. Just like its cousin, it is also made up of three candles, with the middle one being relatively small.
The main difference between them is that in this pattern, the second candlestick is above the other two, not below. Additionally, the first candle will be green, and the third one will turn red, as this pattern signals the end of a rally and the beginning of a downtrend.
Evening Star
The evening star consists of three candlesticks. The first and the third candles both have a large body, while the middle one is rather small.
The first candlestick is bullish, and so is the second one. However, its small size shows that the rally has stalled, which is then confirmed by the third — bearish — candle. It usually signals the beginning of a downtrend.
Evening Doji Star
The evening doji star is very similar to the normal evening star pattern, but its second candle is a doji with an almost non-existent body. Just like the morning doji star, it shows indecisiveness in the market, although this time, it signals a possible reversal into a bearish direction.
Dark Cloud Cover
The dark cloud cover is another strong pattern. It is formed by two candles, first a bullish and then a bearish one. Both of them are strong, with big bodies and average-sized wicks.
This pattern shows a situation in which the price of an asset tries to push to a new, higher position but ultimately fails and closes below its opening. It signals a bearish reversal trend.
Hanging Man Candlestick
The hanging man is formed by just one candlestick. It has a small body with a short upper wick and a long lower one. Essentially, it is the same as the hammer candle. This candlestick is called a hanging man when it comes at the end of a bull run. Just like its bullish counterpart, it signals a possible price reversal.
Bearish Engulfing
The bearish engulfing is the opposite of the bullish engulfing pattern. This time, it’s the bearish candle that engulfs the smaller body of the preceding bullish one. It shows that although the asset’s value briefly rallied above the highest point of the previous candlestick, it still closed below both its own opening and the opening price of the preceding candle. This usually leads to a bearish reversal.
How Is Reversal Different from Retracement?
In trading, understanding the difference between a trend reversal and a retracement is key. A trend reversal signifies a significant change in the market’s direction, marking the end of an existing trend and the start of a new one. This shift is often identified by patterns like head and shoulders or double top/bottom, indicating a substantial change in market sentiment. These reversals usually have a longer duration and are critical in signaling new trends.
Contrastingly, a retracement is a temporary reversal within an ongoing trend. It’s seen as a minor market correction and is usually short-lived. Tools like Fibonacci retracement levels or moving averages help identify potential support or resistance levels during these movements. Unlike reversals, retracements don’t signify a complete trend change but are more like brief pauses in the existing trend.
How to Use Reversal Candlestick Patterns
Reversal candlestick patterns are vital for traders to spot shifts in market trends. Patterns like the bullish reversal doji, reversal hammer, and bearish engulfing pattern can indicate changes from bearish to bullish trends and vice versa.
Traders should use these patterns alongside confirmation signals, like a subsequent higher or lower candle close, to validate potential trend reversals. For instance, a bullish reversal doji following a downtrend may signal an upcoming uptrend, especially if followed by a higher closing candle.
What to Do When Reversal Candle Formations Appear
Upon spotting reversal candle formations, traders should act swiftly to assess potential market direction changes. Recognizing patterns such as bullish engulfing or shooting stars is crucial. The key is to understand these indicators and integrate them into your trading strategy effectively, managing open positions accordingly and potentially capitalizing on new market directions.
Entry Points
Identifying entry points involves recognizing single, dual, or three-candlestick patterns. Traders should enter a position in the direction of the reversal at the opening of the next candle, leveraging the potential trend change without awaiting further confirmation.
Stop Loss
A stop loss is an essential risk management tool. For bullish reversals, set it below the pattern’s low; for bearish reversals, above the pattern’s high. This strategy helps safeguard against market movements that oppose the anticipated trend.
Take Profit
Setting a take profit level involves verifying it’s at least twice the distance from the entry point to the stop loss. This ratio ensures a favorable risk-reward balance, aligning with your risk management strategy and maximizing potential gains while minimizing potential losses.
Are All Reversal Candles Reliable?
Reversal candles, popular in technical analysis, are not always reliable indicators of market reversals. While they can be useful, their effectiveness varies depending on several factors. The accuracy of these indicators often depends on the market context and the specific candlestick pattern being analyzed. For instance, an inverted hammer may indicate a potential rally in a downtrend, but it requires confirmation from subsequent trading periods to validate this prediction.
Traders should not solely rely on reversal candles for decision-making. Instead, they should consider these patterns as part of a broader trading strategy that includes other technical indicators and a thorough analysis of the current trend. Understanding the limitations of these patterns is crucial in preventing over-reliance on them and making more informed trading decisions.
Advantages and Limitations of Candlestick Patterns
Candlestick patterns are renowned for providing visual cues about bullish and bearish trends in the market, thus assisting traders in anticipating future price movements. Patterns like the morning doji star pattern and the hammer pattern can signal potential shifts in market sentiment, helping traders to identify potential entry and exit points.
On the other hand, there’s always one of the main limitations of candlestick patterns — their subjective interpretation. Interpretations of the same pattern might vary and lead to contrasting trading decisions.
Additionally, these patterns can sometimes produce false signals, particularly in volatile markets. To mitigate these limitations, it’s advisable to use candlestick patterns in conjunction with other forms of technical analysis, such as support levels, continuation patterns, and momentum oscillators. This multifaceted approach helps to validate the signals provided by candlestick patterns and enhance the reliability of trading predictions.
Common Mistakes to Avoid in Interpreting Candlestick Patterns
Interpreting candlestick patterns effectively is key to successful trading, but there are common mistakes that traders should be wary of.
One such mistake is analyzing these patterns in isolation without considering the broader market context. For instance, a Doji candle may indicate indecision in the market, but its significance is better understood when viewed in relation to the current trend and surrounding candlestick formations.
Another error is overlooking the importance of volume in validating candlestick patterns. High trading volume can reinforce the credibility of a pattern, such as a continuation candlestick pattern, indicating a stronger market commitment to the current trend or a potential reversal.
This holistic approach reduces the risk of misinterpretation and allows for more accurate and dependable trading decisions.
What Is the 3 Candle Reversal Strategy?
The 3 candle reversal strategy is a technical analysis method used in trading to identify potential reversals in the market trend. It’s based on the observation and interpretation of a specific sequence of three candlesticks on a chart. Here’s how it typically works:
- Identification of a Trend: The first step involves identifying the prevailing trend in the market, whether it’s upward (bullish) or downward (bearish). This strategy is most effective when applied after a strong and clear trend.
- The Three Candle Pattern: The strategy looks for a specific pattern of three candles:
- First Candle: This is in line with the current trend. For a bullish trend, this would be an upward candle (usually green), and for a bearish trend, a downward candle (usually red).
- Second Candle: This candle starts to show the reversal. In a bullish trend, it would open higher but close below the midpoint of the first candle. In a bearish trend, it would open lower but close above the midpoint of the first candle.
- Third Candle: The key candle that confirms the reversal. For a bullish trend reversal, this candle should close well into the body of the first candle (ideally below it). For a bearish trend reversal, it should close well above the body of the first candle.
- Confirmation and Entry: Traders look for additional confirmation signals on the fourth candle or through other technical indicators like volume, support and resistance levels, or momentum indicators. Entry points are often considered at the close of the third candle or the open of the fourth, depending on confirmation.
- Risk Management: As with all trading strategies, risk management is crucial. This involves setting appropriate stop-loss orders and take-profit targets to protect against potential losses and lock in profits.
The 3 candle reversal strategy is popular because it’s relatively simple and can be applied across various time frames and markets. However, it’s important to note that no strategy guarantees success, and this approach should be used in conjunction with other analysis tools and a clear understanding of market conditions.
FAQ
What is the best time frame for day trading?
The 15-minute time frame is the best one for day trading. It is short enough to allow you to make quick decisions yet long enough to give you a good idea of what is going on in the market.
What is the best indicator for trend reversal?
There is no one best indicator for trend reversal. Some popular indicators that can be used to identify trend reversals are the moving average convergence divergence (MACD) indicator, the relative strength index (RSI) indicator, and the stochastic oscillator.
What’s bullish reversal strength?
The strength of a bullish reversal refers to the likelihood of the reversal actually happening.
What is a reversal candlestick pattern?
A reversal candlestick pattern is a formation that occurs on a candlestick chart indicating a potential change in the market direction. There are bullish and bearish reversal patterns.
How do you spot a reverse candle?
The best way to spot reserve candles is to memorize the most common patterns, such as the bearish and the bullish engulfing, three white soldiers, three black crows, and so on.
What is the strongest reversal candlestick pattern?
Some of the most powerful candlestick patterns include the bullish engulfing pattern, the morning star pattern, and the evening star pattern. These patterns tend to be more reliable than other ones.
What are bullish reversal candlestick patterns?
Bullish candlestick reversal patterns are formations that occur on a candlestick chart indicating a potential change in the market direction from bearish to bullish.
Disclaimer: Please note that the contents of this article are not financial or investing advice. The information provided in this article is the author’s opinion only and should not be considered as offering trading or investing recommendations. We do not make any warranties about the completeness, reliability and accuracy of this information. The cryptocurrency market suffers from high volatility and occasional arbitrary movements. Any investor, trader, or regular crypto users should research multiple viewpoints and be familiar with all local regulations before committing to an investment.


can i get clomid without a prescription where can i buy cheap clomid pill generic clomid pill where to buy clomid pill where to get clomid pill how to buy generic clomid pill where can i buy generic clomid pill
Greetings! Extremely serviceable advice within this article! It’s the scarcely changes which will turn the largest changes. Thanks a lot for sharing!
More posts like this would force the blogosphere more useful.
azithromycin 500mg ca – zithromax 250mg ca buy flagyl
buy rybelsus 14 mg generic – buy generic semaglutide online buy periactin online
motilium 10mg ca – buy flexeril 15mg pills cyclobenzaprine sale